
IELTS TASK 1: Bar charts (Comparing male and female workers in the UK)
The charts give information about employment in the UK in 1998 and 2012. Summarise the information by selecting and reporting the main features, and make comparisons where relevant.
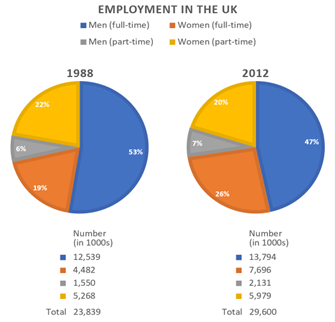
The bar charts compare the percentage of male and female employees in the years 1988 and 2012. These figures can be split into 2 discrete demographics: men and women.
Overall, the number of people employed in the UK has increased moderately from 23,839 thousand to 29,600 thousand. While the number of men working was higher than that of women in both years, the number of female employees had risen by 2012.
The percentage of full-time male employees remained the largest in the workforce, at 53% in 1988 and 47% in 2012. The number of men working part time has increased from 1,550 thousand to 2,131 thousand people. However, their percentage remained relatively the same at around 6% to 7%.
The number of women working full time has increased markedly from 4,482 thousand to 7,696 thousand people, the percentage of which has risen by 7%. In 2012, the percentage of part-time female employees decreased slightly from 22% to 20%.
Top answer
The bar (wrong. ) i n the years 1988 and 2012. These figures (wrong word) can be split into 2 discrete demographics: men and women .
- The bar (wrong.
- ) i n the years 1988 and 2012.
- These figures (wrong word) can be split into 2 discrete demographics: men and women .
- (You already wrote male and female.
- This is repetitive and "two figures" means that one of the charts is for men, and the other for women.
Get the Weekly English Kit 📬
New words, one handy idiom, and a 2-minute quiz — delivered to your inbox to keep your streak alive.
The bar (wrong. These are not bar charts.) charts compare the percentage of male and female employees (incorrect.) in the years 1988 and 2012. These figures (wrong word) can be split into 2 discrete demographics:
 Related Questions