
Ielts Task 1 - Bar Chart - Please give me your opinion on this.
The chart illustrates the international selling of four types of digital games (mobile phone, online, console, and handheld) in six years between 2000 and 2006. Units are measured in billion American dollar.
Overall, handheld games always achieved the highest global sales over the period given. The others had a tendency to increase in sales, except console games, which decreased over the years.
In terms of handheld games, the worldwide sales were almost 12 billion in 2000. Then, this figure rose steadily to reach a peak of around 18 billion in the final year. On the other hand, people didn’t show their preference for console games over the period shown. The international sales started at around 6 billion in the first year, then constantly decreased and dropped to just 3 billion in final year.
The proportion of mobile phone games sales was at 0 in the first two years. However, the figure started to climb gradually from 2002 to 2006 (2 billion and around 7 billion respectively). There was a similar growth in the number of online games sales, which was evident reaching 1 billion in 2001 and around 9 billion in the final year. 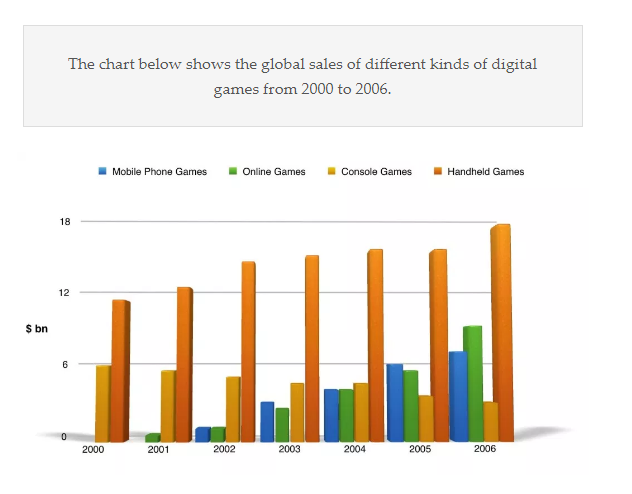
Top answer
) chart illustrates (wrong word) the global international selling (wrong word) of four types of digital games (mobile phone, online, console, and handheld) in the six-year period six years between 2000 and 2006. Units are measured in billion American dollar . (wrong form) Overall, handheld games always achieved the highest global sales over the period given.
- ) chart illustrates (wrong word) the global international selling (wrong word) of four types of digital games (mobile phone, online, console, and handheld) in the six-year period six years between 2000 and 2006.
- Units are measured in billion American dollar .
- (wrong form) Overall, handheld games always achieved the highest global sales over the period given.
- The others had a tendency to increase in sales, except console games, which decreased over the years.
- In terms of handheld games, the worldwide sales were almost 12 billion in 2000.
Get the Weekly English Kit 📬
New words, one handy idiom, and a 2-minute quiz — delivered to your inbox to keep your streak alive.
The (what kind of chart?) chart illustrates (wrong word) the global international selling (wrong word) of four types of digital games (mobile phone, online, console, and handheld) in the six-yea
 Related Questions