
IELTS TASK 1 - BAR CHART - Please Check This Summary. Thank you so much!!!
The bar chart compares how many jobs there were in a UK city in three industries related to tourism from 1989 to 2009.
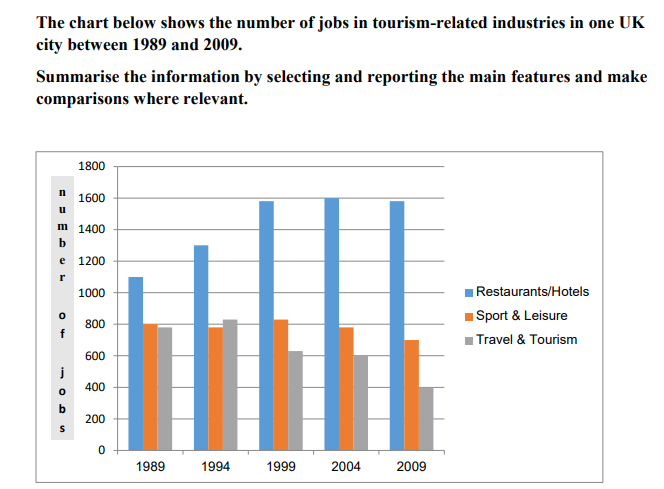
Overall, it is clear that there were more jobs in restaurants and hotels than in the other categories throughout the period. There was a declining trend over the period in the number of jobs in travel and tourism.
In the restaurant and hotel industry, the number of jobs increased from 1100 in 1989 to reach a peak of 1600 in 2004. Numbers then fell slightly to 1580 in 2009. In contrast, the number of jobs in sport and leisure remained fairly constant. From a figure of 800 in 1989, the jobs total fluctuated slightly around this number, before falling to 700 at the end of the period. Finally, the figure for jobs in travel and tourism rose from 780 to 830 from 1989 to 1994. However, this number declined to 630 and then 600 in 1999 and 2004, respectively. By 2009, the number of jobs in this sector had decreased to just 400.
Top answer
The bar chart compares how many jobs there were in a UK city in three industries related to tourism from 1989 to 2009. (incomplete. What are the three industries?
- The bar chart compares how many jobs there were in a UK city in three industries related to tourism from 1989 to 2009.
- (incomplete.
- What are the three industries?
- How frequent are the bars, or what is the time period between them?
- ) there were more jobs in restaurants and hotels than in the other categories (The reader has no idea what these categories are.
Get the Weekly English Kit 📬
New words, one handy idiom, and a 2-minute quiz — delivered to your inbox to keep your streak alive.
The bar chart compares how many jobs there were in a UK city in three industries related to tourism from 1989 to 2009. (incomplete. What are the three industries? How frequent are the bars, or what is the time period between them? )
Overall, it is clear that (Avoid the "opinion words - "clear, evident, noticeable and apparent" in Task 1.) there were more jobs in
The bar chart illustrates the total amount of employment in terms of three industries related to tourism in a city in the UK over a 20-year period from 1989 to 2009 with the data measured in the number of jobs.
Overall, the figure for restaurants or hotels remained at a higher rate with the trend experiencing an upward trend throughout the period whereas trav
 Related Questions