
IELTS Task 1 - Bar chart [1B_04]
Task 1 - Bar chart - #04
The chart below shows how frequently people in the USA ate in fast food restaurants between 2003 and 2013.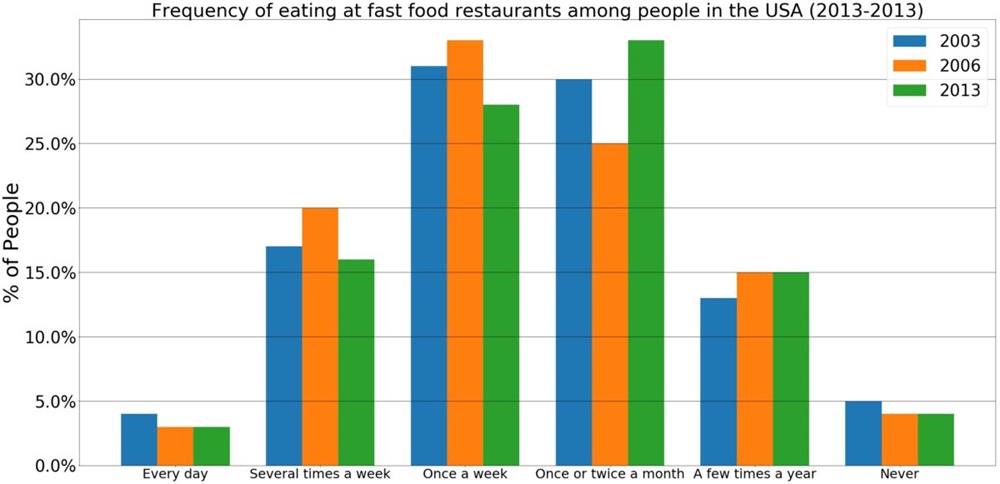
The bar chart plots the habit of fast-food consumption at restaurants in the USA in three disparate years, 2003, 2006 and 2013. The histogram is in the form of a normal distribution, with six categories based on frequencies from "every day" to "never".
Overall, it is clear that there was a trend toward consuming less fast food over time. Also notable is that the incidence of eating this type of food at restaurants evenly centered around the middle two cohorts.
Turning to detail, a majority of people visited fast-food establishments weekly in 2003, at 31%, at which there was a marginal increase of 2% before a fall to 28% in 2013. The median frequency, still presenting a third of all Americans, had shifted from weekly to fortnightly by the end of the period.
Around 16% of fast-food consumers fell into the several-times-a-week category in 2006, outstripping 15% of those who frequented a few times a year in 2013. The chart tailed at two extremes where the data had undergone decreases of 1% during a decade. Nevertheless, the proportion of daily customers were 1% less than that of those who never ate, on average.
Word count: 193 words
Please check this for me. Thank you.
Top answer
The bar chart plots the habit frequency of fast-food consumption at restaurants in the USA in three disparate y ears, 2003, 2006 and 2013. The histogram is in the form of a normal distribution, with six categories based on frequencies ranging from "every day" to "never". Overall, it is clear that there was a trend toward consuming less fast food over time.
- The bar chart plots the habit frequency of fast-food consumption at restaurants in the USA in three disparate y ears, 2003, 2006 and 2013.
- The histogram is in the form of a normal distribution, with six categories based on frequencies ranging from "every day" to "never".
- Overall, it is clear that there was a trend toward consuming less fast food over time.
- Also notable is that the frequencies represented by incidence of eating this type of food at restaurants evenly centered around the middle two cohorts were the highest .
- Turning to detail, a majority of people visited fast-food establishments weekly in 2003, at 31% of people in the US had a meal at a fast-food place once a week, ….
Get the Weekly English Kit 📬
New words, one handy idiom, and a 2-minute quiz — delivered to your inbox to keep your streak alive.
The bar chart plots the habit frequency of fast-food consumption at restaurants in the USA in three disparate years, 2003, 2006 and 2013. The histogram is in the form of a normal distribution, with six categories based on frequencies ranging fro
 Related Questions