
IELTS Task 1 - Bar chart [1B_03]
Task 1 - Bar chart - #03
The charts show the percentage of income spent on food and other goods in 3 European countries from 1998 – 2008.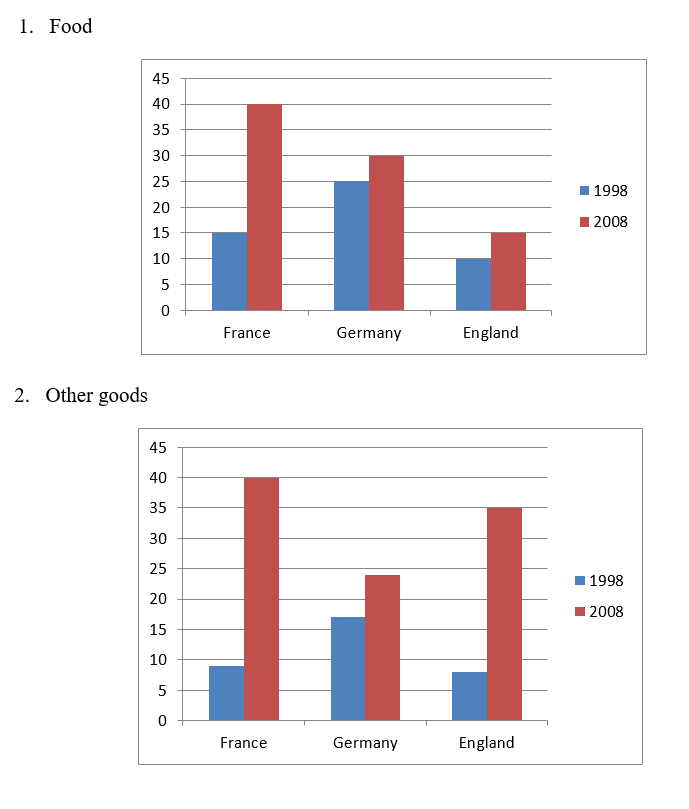
The graphs present the percentages of expenditure for nourishment and other products in comparison to total income in France, Germany, and England in two separated years 1998 and 2008.
Overall, albeit German citizens allotted the largest portion of their wages for these essentials in 1998, French people spent the most in 2008. It is also noticeable that people in three countries spent more money on all items over time.
Taking a glance at foodstuffs, the allocated budget of the French for these commodities took up 40% in 2008, nearly three times as much as it was at the beginning. The German, conversely, added only 10% of their earnings to their spending. 10% was also the increase observed in England, though the amount spent here was far smaller than the others, at a maximum of 15%.
Regarding other items, expenses paid by the German were the greatest, at approximately 17%, outspending the French and the British by 10% in 1998. Ten years later, there were apparent rises of around 30% in goods' expenditure in the former two countries, yet the opposite was true for German, where an 8% growth can be witnessed.
Word count: 190 words
Please check my essay. Thank you.
Top answer
) present the percentages of expenditure for nourishment (not a good word) and other products in comparison to total income in France, Germany, and England in two separated years 1998 and 2008. Suggested opening. This gives the reader a much clearer description of the figure.
- ) present the percentages of expenditure for nourishment (not a good word) and other products in comparison to total income in France, Germany, and England in two separated years 1998 and 2008.
- Suggested opening.
- This gives the reader a much clearer description of the figure.
- The two bar charts, the first labelled "food" and the second "other goods", compare the percentage of their total income that people in France, Germany and England, spent in each of two separate years, 1998 and 2008.
- Overall, albeit German s citizens allotted the largest portion of their wages for these two categories essentials in 1998, the French people spent the most in 2008.
Get the Weekly English Kit 📬
New words, one handy idiom, and a 2-minute quiz — delivered to your inbox to keep your streak alive.
The graphs (How many and what kind?) present the percentages of expenditure for nourishment (not a good word) and other products in comparison to total income in France, Germany, and England in two separated years 1998 and 2008.
 Related Questions