
IELTS TASK 1 - BAR CHART
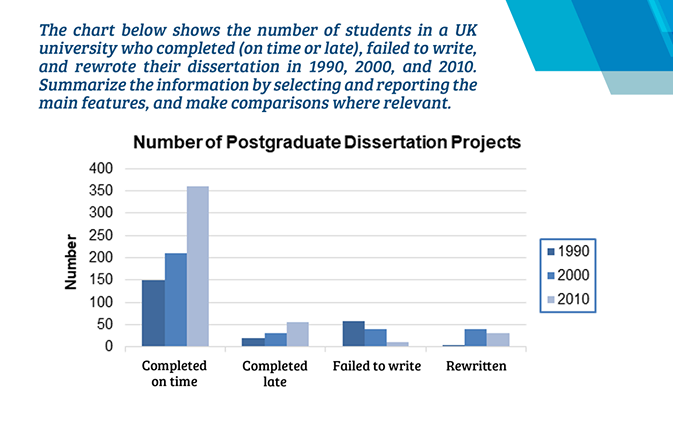
The bar chart gives information about the status of dissertotions completed by students at a particular university in the UK in the years 1990, 2000 and 2010. Overall, the number of students who completed and rewrote their dissertation increased significantly across the period, as opposed to a constant drop in the number of students who failed to write one. It is also noticeable that the completion rate was far higher than the figure one, with the largest number of students finished on time.
In 1990, about 150 and 20 students respectively submitted their dissertations ont?me and late, compared with about 60 failing to write and a mere 5 hoving to resubmit their project. The completion rates then rose markedly, with the figures for those completing before and after the deadline being 360 and 55, in turn, in 2000.
By comparison, while the number of undergraduates who hod to rewrite their dissertations jumped to around 40 in 2000, followed by a slight fall to 30 in 2010, the figure for those who were unsuccessful observed a pronounced drop to only 10 in the last surveyed year.
Help me to correct it!!!
Thanks!!!
Top answer
The bar chart gives information about the status of disser t a tions completed by of students at a particular university in the UK in the years 1990, 2000 and 2010. Overall, the numbe r s of students who completed and of those who rewrote their dissertatio n s increased significantly across the period, over those years, as opposed to a constant the drop in the number of students who failed to write one. It is also noticeable that the completion rate was far higher than the figure one , with the largest number of students finished finish ing their dissertations on time.
- The bar chart gives information about the status of disser t a tions completed by of students at a particular university in the UK in the years 1990, 2000 and 2010.
- Overall, the numbe r s of students who completed and of those who rewrote their dissertatio n s increased significantly across the period, over those years, as opposed to a constant the drop in the number of students who failed to write one.
- It is also noticeable that the completion rate was far higher than the figure one , with the largest number of students finished finish ing their dissertations on time.
- me , while 20 students were and late, compared with about 60 failing to write their thesis and a mere 5 h a ving to resubmit their work.
- project.
Get the Weekly English Kit 📬
New words, one handy idiom, and a 2-minute quiz — delivered to your inbox to keep your streak alive.
The bar chart gives information about the status of dissertations completed by of students at a particular university in the UK in the years 1990, 2000 and 2010. Overall, the number
 Related Questions