
IELTS task 1 Bar chart
Please help me to review this report. I find it quite difficult to group the information. Please let me know if the writing is cohesive enough. Thank you in advance!
--
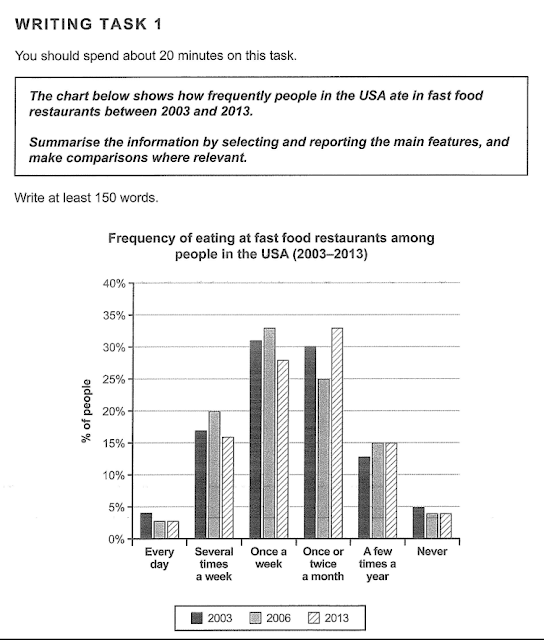
The bar chart illustrates the percentage of the Americans consuming fast food on different levels of frequency over a decade, starting from 2003.
Overall, it is clear that most people in the US eating fast food on a weekly basis between 2003 and 2006, whereas in 2013, the proportion of fast food consumption once or twice a week was the biggest.
Looking at the chart more closely, in 2003, the percentage of the Americans having fast food daily was almost 5% which then decreased insignificantly by 1% in 2006. Similarly, the proportion of those who never eat fast food fell marginally between 2003 and 2006 while that of those who eat once or twice a week declined dramatically from 30% in 2003 to 25% in 2006. In contrast, the figures for fast food consumption several times a week, once a week, and a few times a week experienced an average increase of 3%.
Ten years later, in 2013, the proportions of American citizens consuming fast food every day, several times a week, and once a week went down slightly. This trend was also the same for those who never consume fast food. On the other hand, the percentages of consumption once or twice a month, and a few times a year went up moderately about 3%.
215 words
Top answer
The bar chart plots illustrates the percentage of the Americans who ate at fast-food restaurants consuming fast food on different levels of at six different frequency levels for the years 2003, 2006 and 2013. over a decade, starting from 2003. The frequencies are shown on the X-axis in decreasing frequency order: every day, several times a week, once a week, once or twice monthly, a few times yearly, and never.
- The bar chart plots illustrates the percentage of the Americans who ate at fast-food restaurants consuming fast food on different levels of at six different frequency levels for the years 2003, 2006 and 2013.
- over a decade, starting from 2003.
- The frequencies are shown on the X-axis in decreasing frequency order: every day, several times a week, once a week, once or twice monthly, a few times yearly, and never.
- Overall, it is clear that (Words such as "clear, evident, apparent, noticeable, obvious" are opinion words.
- Just describe the data.
Get the Weekly English Kit 📬
New words, one handy idiom, and a 2-minute quiz — delivered to your inbox to keep your streak alive.
The bar chart plots illustrates the percentage of the Americans who ate at fast-food restaurants consuming fast food on different levels of at six different frequency levels for the years 2003, 2006 and 2013. over a decade, starting from 2003.
 Related Questions