
IELTS task 1 - bar chart.
The charts give information about two genres of TV programmes watched by men and women and four different age groups in Australia.
Summarise the information by selecting and reporting the main features, and make comparisons where relevant.
Answer
The diagrams depict the proportion of two genders who watched two kinds of TV programmes such as reality shows and game shows for four various age group in Australia.
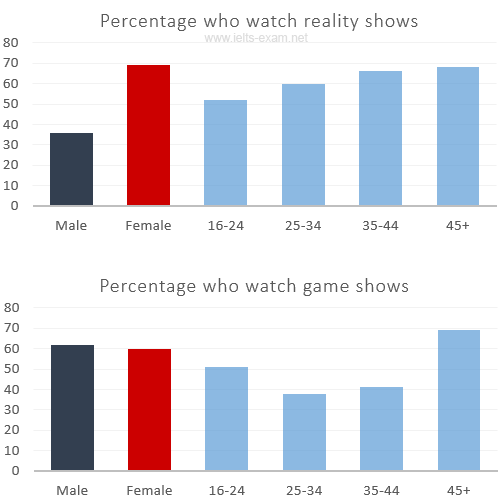
Overall, the percentage of female is higher than that of male. However, there is a plateau rate in both TV shows for the group aged 16 to 24 and over-45s, while people who aged from 25 to 44 prefer reality shows than game shows.
According to the diagrams, in reality shows, 70% is the proportion of female which is twice as that other. In contrast, male is prone to watch game shows and its percentage accounted for 61%, overtaking that female by 1%.
In reality shows, there is a linear increase in the percentage of viewers according to the level of age. The 16- to 24-year- olds rate amounts to a half, and reaching the highest percentage at above two - third in over-45s age group. In comparison with the game shows, there was the same rate for people in those groups. Meanwhile, the middle-age, namely from 25 to 44, its proportion makes up roughly 40% in game shows, this is lower twofold than that reality shows.
Top answer
The diagrams depict the proportion of two genders who watched two kinds of TV programmes such as (Such as means: the following are examples. In this case, they are not examples, they are the real things. ) reality shows and game shows for four various age group in Australia.
- The diagrams depict the proportion of two genders who watched two kinds of TV programmes such as (Such as means: the following are examples.
- In this case, they are not examples, they are the real things.
- ) reality shows and game shows for four various age group in Australia.
- The bar charts depict the percentages of Australian men and women who watched certain kinds of TV shows, the first showing reality shows and the second game shows.
- Each chart also shows the proportion of adults who watched these shows by age group.
Get the Weekly English Kit 📬
New words, one handy idiom, and a 2-minute quiz — delivered to your inbox to keep your streak alive.
The diagrams depict the proportion of two genders who watched two kinds of TV programmes such as (Such as means: the following are examples. In this case, they are not examples, they are the real things. ) reality shows and game shows for four various age
ANSWER
The bar charts illustrate the proportion of people watching two kinds of TV programmes in terms of two genders and 4 age groups in Australia.
Overall, the percentage of women watching reality shows dominates over men, also that people over 45 years old tend to spend more time on both game and reality programmes than those from other groups.
It is obvious that there is
 Related Questions