
Ielts task 1: Bar chart
WRITE DESCRIPTION HERE
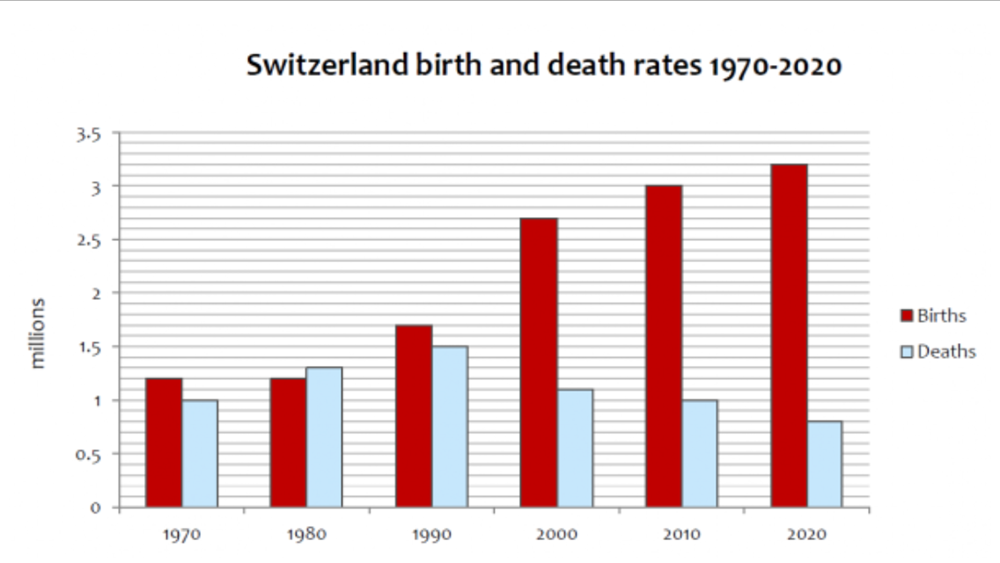
The bar chart illustrates the number of birth and mortality in Switzerland between 1970 and 2020.
Overall, the birth rate was higher than the mortality rate except for that in 1980. While the birth rate saw a substantial increase, there was a change in the mortality rate throughout the period shown.
As can be seen from the chart, in 1970, the rate of birth recorded at 1.2 million, which was 0.2 million higher than that of death. In the next 10 years, the birth rate remained unchanged, whereas the mortality rate slightly increased to 1.3 million. In subsequent years, the rate of mortality declined from its peak of 3.2 million to 1 million till 2010. In constrast, the birth rate experienced a steady rise to 3 million in 2010. At the end of the period, the birth rate is expected to be over three times as high as the mortality rate, at 3.2 million and 0.8 million respectively.
Top answer
The bar chart illustrates the numbe r s of birth s and mortality mortalities, in millions of individuals, in Switzerland between 1970 and 2020. Overall, the birth rate was higher than the mortality rate except for that i n 1980. While the birth rate saw a substantial increase, there was a n initial rise change in the mortality ra te followed by a fall in throughout the period shown.
- The bar chart illustrates the numbe r s of birth s and mortality mortalities, in millions of individuals, in Switzerland between 1970 and 2020.
- Overall, the birth rate was higher than the mortality rate except for that i n 1980.
- While the birth rate saw a substantial increase, there was a n initial rise change in the mortality ra te followed by a fall in throughout the period shown.
- 2 million higher than that of the number of death s .
- 3 million.
Get the Weekly English Kit 📬
New words, one handy idiom, and a 2-minute quiz — delivered to your inbox to keep your streak alive.
The bar chart illustrates the numbers of births and mortality mortalities, in millions of individuals, in Switzerland between 1970 and 2020.
Overall, the bi
The bar chart compares the number of births and deaths in switzerland over a 50 year period between 1970 to 2020.
Overal, it is clear that the birth rate was higher than the death rate except for that in 1980.while the birth rate saw a slightly increase,there was a change in the death rate over the period shown.
In terms of birth rates was noticeably higher in 2000,2010 and 2020
 Related Questions