
IELTS Task 1 about customer services
The charts below show the results of a questionnaire that asked visitors to the Parkway Hotel how they rated the hotel's customer service. The same questionnaire was given to 100 guests in the years 2005 and 2010.
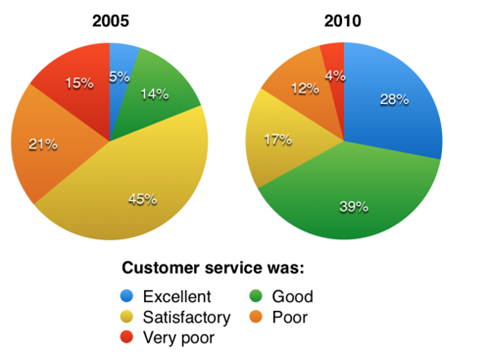
The pie charts indicate how customer services supplied by the Parkway hotel met traveler satisfaction in the two different years 2005 and 2010.
As can be seen clearly, the majority of participants in the questionnaire said they pleased with service quality. Overall, the percentages of positive responses went up remarkably over the five-year period.
In 2005, only 5% of those who were asked rated services at the Parkway hotel as excellent, but this number increased more than fivefold to just below 30% five years later. Likewise, the year 2010 also witnessed a considerable rise in the proportion of respondents judging the hotel’s service as good, from about 15% to around 40%. Despite the most impressive figure in 2005, the hotel service was then rated as satisfactory by far fewer visitors, with the percentage dropping by just over a quarter of the total to 17% in 2010.
As regards negative feedbacks, the trends were substantially downward. The proportion of guests who considered services at the hotel poor halved to approximately 10% by 2010. Similarly, in that year, the tiny minority (nearly 5%) of travelers were highly dissatisfied with customer services, which was a decrease of roughly 10% compared to in the year 2005.
Get the Weekly English Kit 📬
New words, one handy idiom, and a 2-minute quiz — delivered to your inbox to keep your streak alive.
 Related Questions