
IELTS task 1
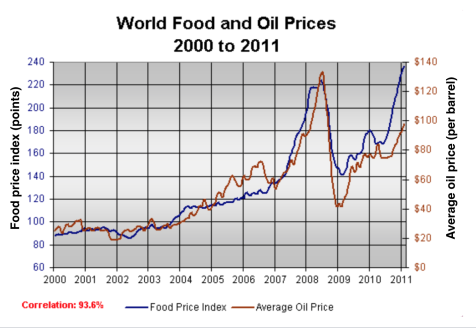
The line graph describes the changes in the world food and oil prices over the period of 11 years, from 2000 to 2011. In general, both commodity prices witnessed an increase from the beginning to the end of the period, except for a sudden decline between 2008 and 2009. The trends of these two prices were very similar, which suggests a strong correlation between them (93.6%).
From 2000 to 2007, there was a relatively steady increase in both the food and oil prices. The food price index grew from 90 to nearly 140 points and the oil price rose from just above 20$ to approximately 60$ per barrel.
From 2007 to the mid of 2008, a dramatic rise was seen in both commodity prices, with the food price index climbing up over 220 points and the average oil price reaching a peak of around 130$ per barrel. However, by early 2009, the food index was down to 140 points while the oil price also slumped to the point of 40$. Over the following years, food and oil prices increased once again, respectively to about 240 points and 100$ per barrel in 2011.
Top answer
This is the paragraph structure for Task 1. 1. Describe the figure.
- This is the paragraph structure for Task 1.
- 1.
- Describe the figure.
- DO not mention any data values.
- 2.
Get the Weekly English Kit 📬
New words, one handy idiom, and a 2-minute quiz — delivered to your inbox to keep your streak alive.
This is the paragraph structure for Task 1.
1. Describe the figure. DO not mention any data values.
2. "Overview" Pick out 2 or 3 most significant points. The examiner is looking for a good summary of the highlights. If you put them in a separate paragraph, it will be good for your score.
3. Describe some interesting details.
You did not read my advice, since you us
 Related Questions