
IELTS Task 1
Task 1: The bar chart below shows the amount of money invested in each categories from five organizations.
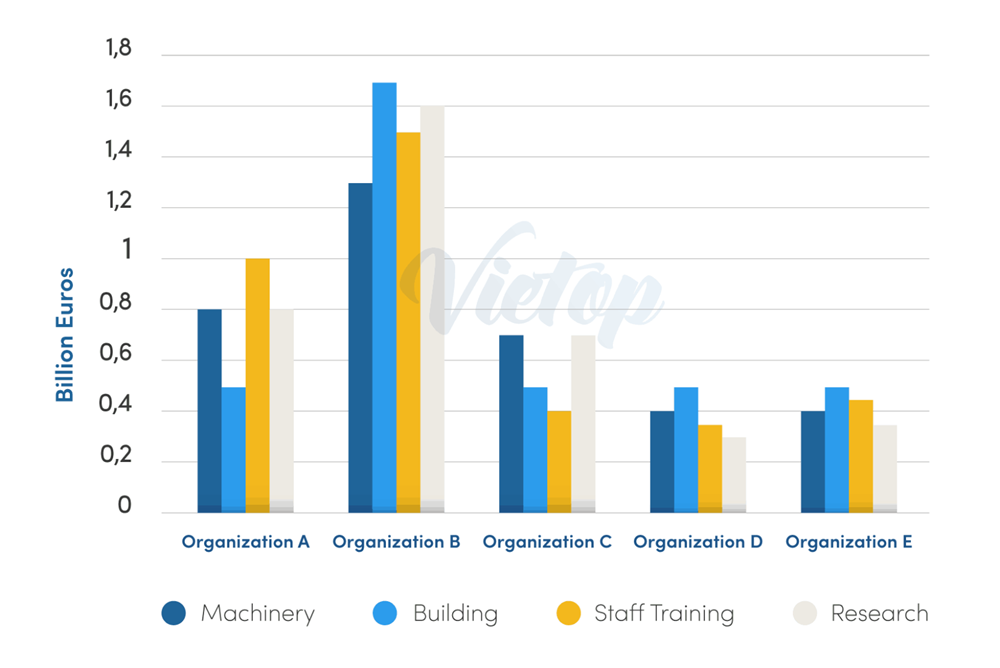
The given bar chart details the financing made by five organizations into four categories, namely Machinery, Building, Staff Training and Research. The measurement for these units is billion Euros.
Overall, organization B financed the most for all four categories among the five companies with the highest budget expended for Building. Organization D and E, on the other hand, are the two corporations with the lowest investment throughout the chart.
Spending money in the field of machinery, organization B spend the most with approximately 1.3 billion Euros, yet this sector still has the least investment comparing to the others. Organization A and C, on the other hand, financed remarkably low with 0.8 and around 0.7 billion Euros respectively. Surprisingly, the budgets of expenditures of organization D and E stand at the same number of 0.4 billion Euros. As regards to Building, organization B spent the most among all the categories surveyed with about 1.7 billion Euros, doubling organization A and C with respectively 0.8 and 0.7 billion Euros in investment. Organization D and E, again, still have the same lowest budget of financing with approximately 0.5 billion Euros.
The third and fourth sectors of staff training and research, still receive the most from organization B with 1.5 and 1.6 billion Euros respectively. Moreover, organization A expended 1 and 0.8 billion Euros sequentially in the same sectors. Organization C respectively allot a budget of 0.4 and 0.7 billion Euros. Meanwhile, organization D and E still have the lowest investment amounting from 0.3 to slightly over 0.4 billion Euros.
Get the Weekly English Kit 📬
New words, one handy idiom, and a 2-minute quiz — delivered to your inbox to keep your streak alive.
 Related Questions