
IELTS task 1
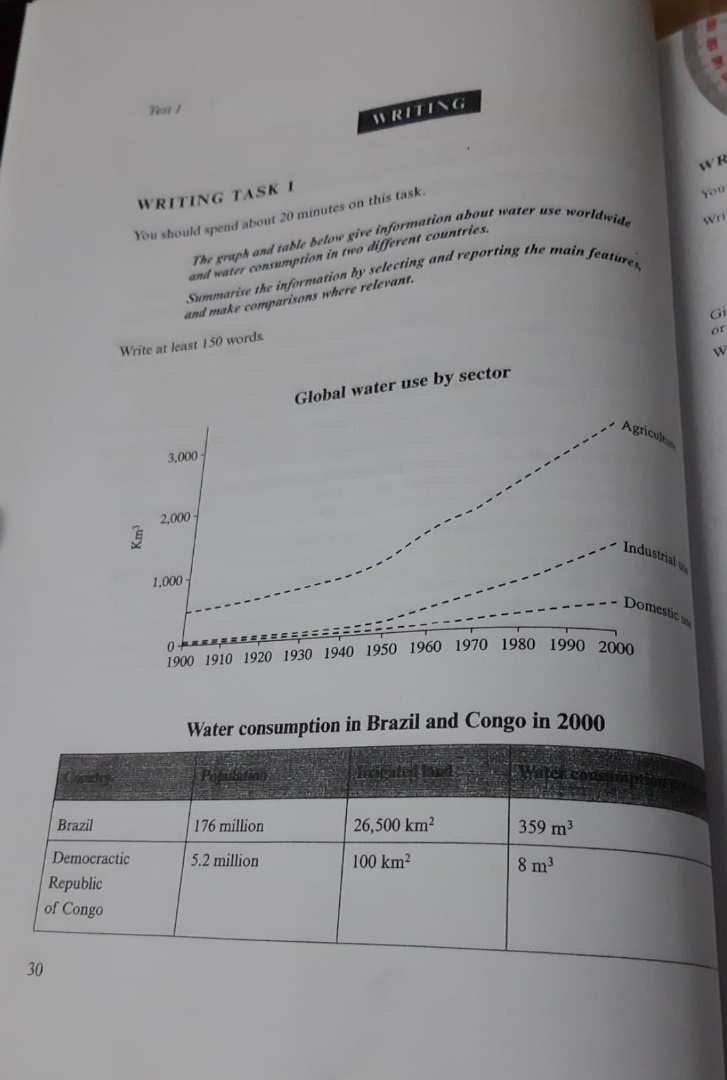
The graph and the table indicated the quantity of water used by sector and water consumption in two countries.
Overall, the global sector's use of water went up steadily over the period. While agriculture showed the most significant growth in using. By the way, there were differences between water consumption in Brazil and Congo in 2000.
In the year of 1900, water use for agriculture amounted to 500km3, which was the greatest consumption at the time. Nevertheless, industrial and domestic usr virtually remained as 0 km3. This situation seems to change gradually through a century, agriculture use increased threefold in 2000. However, this sector still stayed at the top of water consumption, compares to others. In the year of 2000, industrial use went up to about 1000 km3. In contrast, domestic use growed slightly and insignificantly over the period.
There is a clear correlation between population and water consumption in both Brazil and Congo. The table shows the greatest water consumption of per person was found in Brazil, which had population at 176 million. Meanwhile, in Democractic Republic of Congo, which had only 5,2 million people shows individual water consumption at 8 m3. On the other hand, irrigated land of each country was presented in a total contradict way: Brazil land was 26500 km2 and Congo land was up to 100 km2.
Top answer
) graph and the table indicated the quantity of water used by sector and water consumption in two countries. (Incomplete. What is the time period?
- ) graph and the table indicated the quantity of water used by sector and water consumption in two countries.
- (Incomplete.
- What is the time period?
- How many sectors are there?
- What are they?
Get the Weekly English Kit 📬
New words, one handy idiom, and a 2-minute quiz — delivered to your inbox to keep your streak alive.
The (What kind of graph?) graph and the table indicated the quantity of water used by sector and water consumption in two countries. (Incomplete. What is the time period? How many sectors are there? What are they? What are the two countries? You did not describe the table completely, either.)
Overall, the global sector's
 Related Questions