
IELTS Task 1
Hi, everyone. Please help me to correct this essay and give a band score.
The graph below shows the pollution levels in London between 1600 and 2000.
Summarise the information by selecting and reporting the main features, and make comparisons where relevant.
Write at least 150 words.
ANSWER :
The line graph illustrates the pollution levels in London from 1600 to 2000.
Overall, the amount of sulphur dioxide and smoke fluctuated in the period given. In addition, the figure for sulphur dioxide was higher than that of smoke almost all the time surveyed.
In the 1600 - 1850 period, the amount of sulphur dioxide increased. It reached the highest point at about 900 micrograms in 1850. From 1850 to 1900, the figure for sulphur dioxide fluctuated between over 750 micrograms and about 900 micrograms. However, throughout the remainder of the period, there was a sharp fall in the amount of sulphur dioxide, which fell to about 0 in 2000.
In the period from 1600 to the 1880s, the amount of smoke went up from about 50 micrograms to its highest point at about 450 micrograms in the 1880s. The figure for smoke fluctuated between about 100 micrograms and about 350 micrograms in the 1900 - 1950 period. By contrast, during the remainder of the period, there was a gradual decrease in the number of smoke, which dropped to 0 in 2000.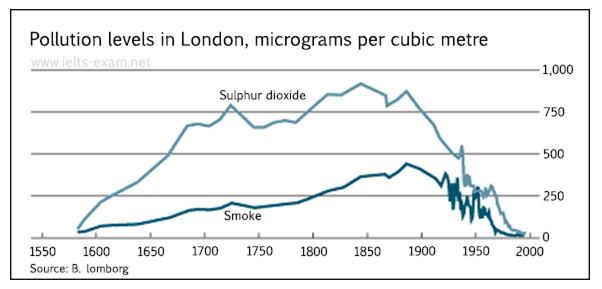
Top answer
The line graph illustrates the pollution levels in London from 1600 to 2000. Overall, the amount of sulphur dioxide and smoke fluctuated in the period given. In addition, the figure for sulphur dioxide was higher than that of smoke for practically almost all the that tim e.
- The line graph illustrates the pollution levels in London from 1600 to 2000.
- Overall, the amount of sulphur dioxide and smoke fluctuated in the period given.
- In addition, the figure for sulphur dioxide was higher than that of smoke for practically almost all the that tim e.
- surveyed.
- In the 160 0-1 850 period, the amount of sulphur dioxide increased steadily from a negligible level until i t reached the highest point at about 900 micrograms in 1850.
Get the Weekly English Kit 📬
New words, one handy idiom, and a 2-minute quiz — delivered to your inbox to keep your streak alive.
The line graph illustrates the pollution levels in London from 1600 to 2000.
Overall, the amount of sulphur dioxide and smoke fluctuated in the period given. In addition, the figure for sulphur dioxide was higher than that of smoke for practically almost all the that tim
 Related Questions