
IELTS graph writing - please take a look, thank you so much
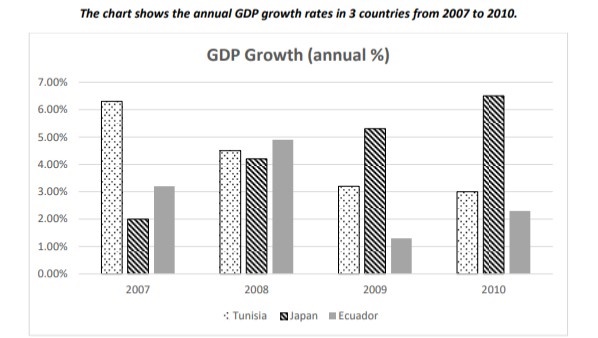
The chart shows the annual GDP growth rates in 3 countries from 2007 to 2010.
Answer:
The bar chart illustrates 3 different nations’ percentage of growth in yearly GDP over a four–year period beginning in 2007.
Overall, it can be seen that the annual GDP rate in Tunisia decreased, whereas Japan’s witnessed a reversed pattern over the years. Also, Ecuador had its figure fluctuating throughout the course.
In the year 2007, Tunisia’s DGP growth was the most significant, by over 6%, nearly doubling that of Ecuador and tripling Japan’s. In the next year, the upturn in Tunisia’s yearly GDP declined by 2.0%, being slightly higher than Japan’s at that time. Ecuador’s GDP rise uplifted to 5%, the highest figure of all in that due course.
Over the 2 following years, the value of GDP growth in Tunisia kept dropping until eventually stopping at 3%. Meanwhile, Japan’s statistics escalated to 6.5%, surpassing Tunisia’s initial value in 2007. The growth in GDP of Ecuador plummeted to only 1.2% in 2009 and then rose by 1% at the end of the period.
(164 words)
I'd be very delighted to be corrected. Thank you.
Top answer
The bar chart illustrates 3 different nations’ percentage of growth in yearly GDP over a four–year period beginning in 2007. s hows the annual GDP growth in Tunisia, Japan and Ecuador for the years 2007 - 2010. Comment: "GDP growth rate" is a specific measure of the health of a country's economy.
- The bar chart illustrates 3 different nations’ percentage of growth in yearly GDP over a four–year period beginning in 2007.
- s hows the annual GDP growth in Tunisia, Japan and Ecuador for the years 2007 - 2010.
- Comment: "GDP growth rate" is a specific measure of the health of a country's economy.
- Do not paraphrase these terms, as they are names of specific statistical measures.
- Overall, it can be seen that (Those are completely unnecessary words.
Get the Weekly English Kit 📬
New words, one handy idiom, and a 2-minute quiz — delivered to your inbox to keep your streak alive.
The bar chart illustrates 3 different nations’ percentage of growth in yearly GDP over a four–year period beginning in 2007. shows the annual GDP growth in Tunisia, Japan and Ecuador for the years 2007 - 2010.
Comment: "GDP growth rate" is a specific measure of the health of a country's economy. Do not paraphrase these terms, as they are names of specific s
 Related Questions