
IELTS Essay Task 1: Transport Preferences Among Young People
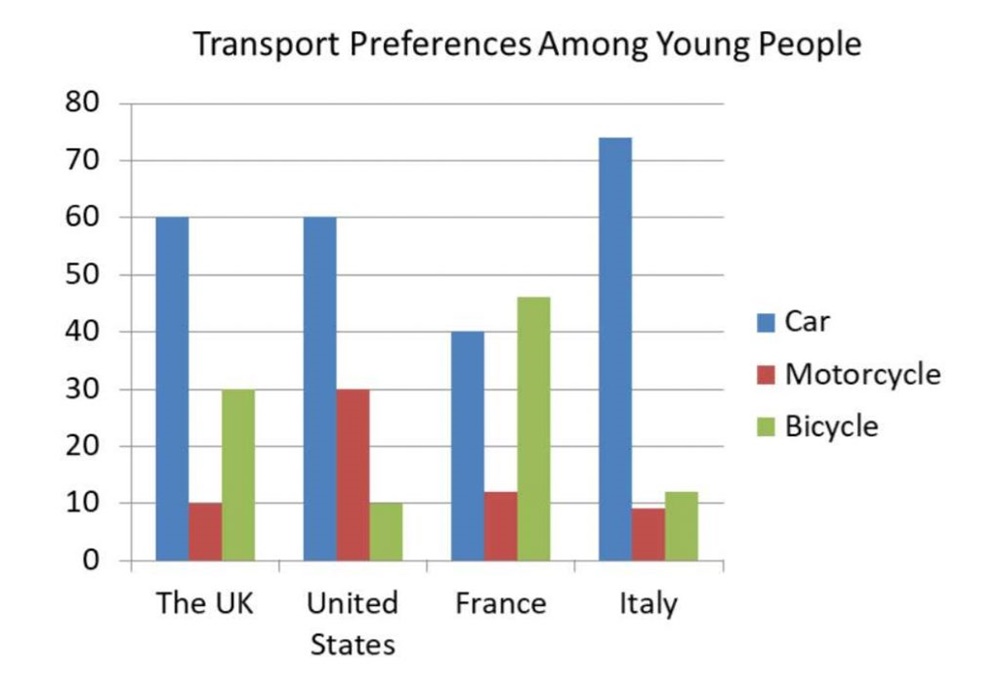
The bar chart details the percentage of younger individuals travelling by three modes of transport in four different countries.
In general, cars are the most common option for all countries with the notable exception of France where the youth prefers to ride bicycles. While motorcycles are the least favoured in most countries, bicycles are in France.
The least used transport in each nation, which is the bicycle in the United States and the motorcycle in the other three countries, constituted similar figures at approximately 10%. However, driving with bikes in France and motorcycles in the US are significant choices of transport among younger people at 47% and 30%, respectively.
Cars remain the most popular as 60% of younger individuals in the UK and the US, and three in every five junior Italians opt for this. By contrast, the statistic for the car in France is slightly lower than that of bicycles, accounting for 40%.
Top answer
Please post ALL the instructions. The bar chart below shows transport preferences among young people in four countries in a single year. Summarise the information by selecting and reporting the main features, and make comparisons where relevant.
- Please post ALL the instructions.
- The bar chart below shows transport preferences among young people in four countries in a single year.
- Summarise the information by selecting and reporting the main features, and make comparisons where relevant.
- Please read my advice for Task 1 essays: IELTS TASK 1: Hints, Tips And Advice Vocabulary Words For Task 1: Reference Post
Get the Weekly English Kit 📬
New words, one handy idiom, and a 2-minute quiz — delivered to your inbox to keep your streak alive.
Please post ALL the instructions.
The bar chart below shows transport preferences among young people in four countries in a single year.
Summarise the information by selecting and reporting the main features, and make comparisons where relevant.
Please read my advice for Task 1 essays:
A lot of this writing is not good English. The paragraphs are too short and choppy.
The bar chart details (wrong word) the percentage of younger individuals travelling by three modes of transport (Unnatural. Poor English. Also what are these "modes"?) in four different countr
 Related Questions