
IELTS Essay Task 1: Social Media Presence for Businesses
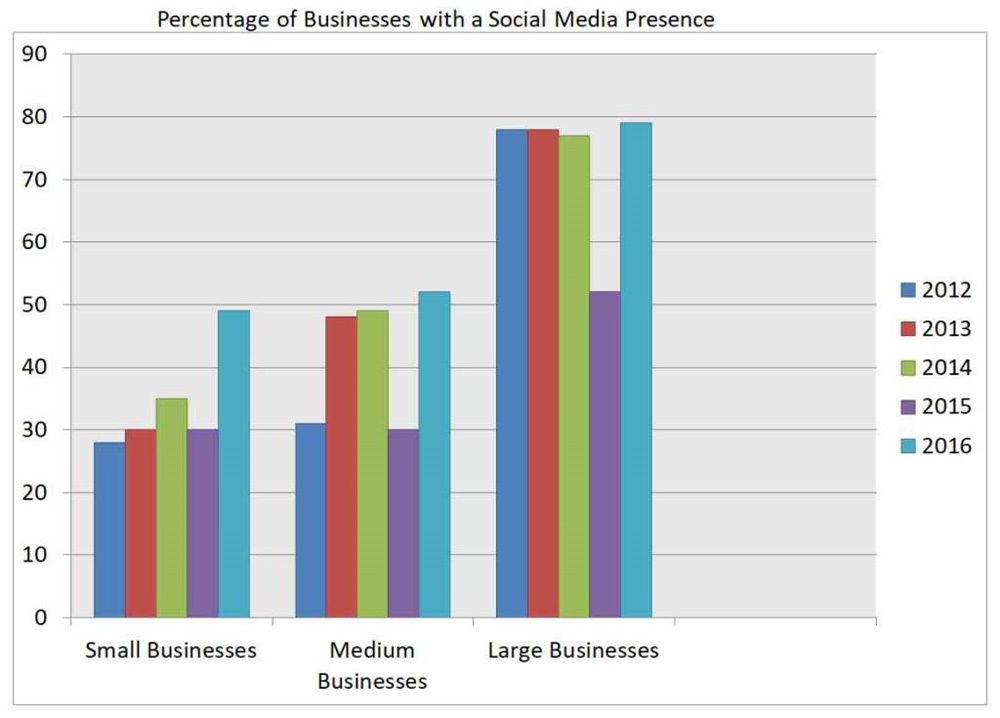
The bar chart displays data concerning the social media presence of small, medium and large businesses in the UK between 2012 and 2016. Looking from an overall perspective, it is readily apparent that figures for all types of businesses grew despite a widespread and significant pullback in 2015. Large businesses increased the least yet had by far the greatest presence each individual year.
In terms of small businesses, less than 30% (the lowest point on the chart) had a social media presence in 2021. This number then rose to 35% by 2014, before a pullback to the 2013 level (30%), and a final surge to fewer than half with a presence to end the period.
The trend for medium-sized businesses was almost identical. This can clearly be seen when the proportions of the two smaller categories in 2015 were exactly the same and the difference in the start and the end of the period years was only approximately 2%. However, the gap widened dramatically as almost half of the medium businesses had a social media presence in the other two years.
Large businesses stayed around 78% for the majority of the period described apart from a dip to 51% in 2015.
Top answer
Please read my advice for Task 1 essays: IELTS TASK 1: Hints, Tips And Advice Vocabulary Words For Task 1: Reference Post
- Please read my advice for Task 1 essays: IELTS TASK 1: Hints, Tips And Advice Vocabulary Words For Task 1: Reference Post
Get the Weekly English Kit 📬
New words, one handy idiom, and a 2-minute quiz — delivered to your inbox to keep your streak alive.
Please read my advice for Task 1 essays:
Phoenix LeeThe bar chart displays data concerning
That is very vague. Write exactly what values are plotted.
Phoenix Leebetween 2012 and 2016.
That is one period, so the reader expects that data to be aggregated for these four years. That is, there is one bar for each type of business.
This expression is ok f
Topic:
The bar chart shows the percentage of the small, medium, large companies which used social media for business purposes between 2012 to 2016.
Sample essay.
The time-series bar chart compares the percentages of businesses which had social media accounts which they used for business purposes each year between 2012 and 2016. They are further grouped by compan
 Related Questions