
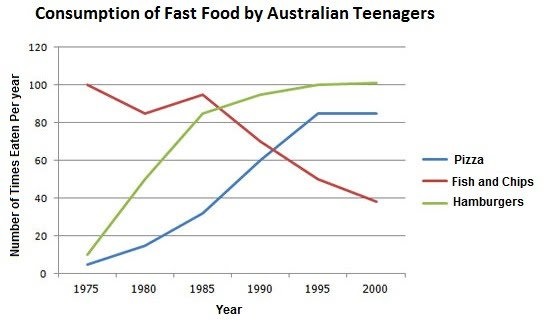
IELTS Academic Writing Task 1/ Graph Writing - Line Graph: » You should spend about 20 minutes on this task. The line graph below shows changes in the amount and type of fast food consumed by Australian teenagers from 1975 to 2000. Summarise the...
WRITE DESCRIPTION HERE
Top answer
Please post essays, paragraphs, dialogues and other writing in the essay forum so a moderator does not have to move your post. htm Please do not put the essay instructions in the "Subject" line. Put it with your answer in the message body.
- Please post essays, paragraphs, dialogues and other writing in the essay forum so a moderator does not have to move your post.
- htm Please do not put the essay instructions in the "Subject" line.
- Put it with your answer in the message body.
- Subject: Please review my IELTS essay Message body: TOPIC : You should spend about 20 minutes on this task.
- The line graph below shows changes in the amount and type of fast food consumed by Australian teenagers from 1975 to 2000.
Get the Weekly English Kit 📬
New words, one handy idiom, and a 2-minute quiz — delivered to your inbox to keep your streak alive.
Please post essays, paragraphs, dialogues and other writing in the essay forum so a moderator does not have to move your post.
https://www.englishforums.com/English/EssayReportCompositionWriting/Forum9.htm
Please do not put the essay instru
TOPIC:
The line graph shows changes in the amount and type of fast food consumed by Australian teenagers from 1975 to 2000.
I have highlighted the text with problems. You need to separate your text into clear paragraphs. Add a blank line after each paragraph so the examiner can clearly see the progression of your essay.
You use the words "consumed" and "consumption" too
 Related Questions