
IELTS Academic Writing Task 1
This is my completed academic writing task 1. Please point out my mistakes and give me a band score for each criterion if possible.
Topic: The first chart below shows how energy is used in an average Australian household. The second chart shows the greenhouse gas emissions which result from this energy use.
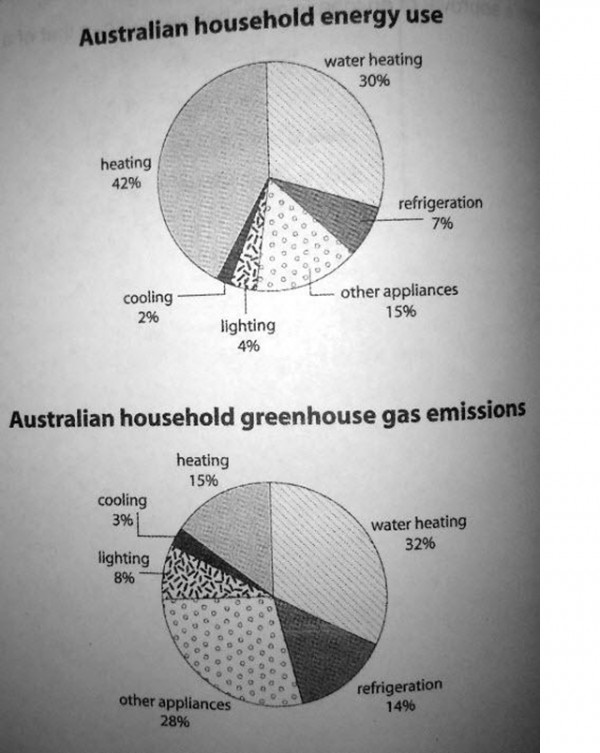
The two pie charts give information about average energy usages in Australian households and the affection of these usages in terms of greenhouse gas emissions. They break down each chart into six groups of energy: heating, water heating, refrigeration, lighting, cooling and other appliances.
Overall, the percentage of energy consumption is higher than the resulting gas emissions in each category except for heating, where the ratio is less than 1:3. In both charts, water heating, heating and other appliances (not heating, water heating, lighting, cooling or refrigeration) made up the majority ( 77% in energy use and 75% in gas emissions), whereas the energy consumption and gas emissions of cooling and lighting are quite insignificant.
In terms of energy usage, the two largest single categories are heating (42%) and water heating (30%). In addition, the percentage of refrigeration and other applications gas emissions is at 38%, which is nearly twice as much as consumption. Finally, the fraction of cooling and lighting in both charts is relatively small, less than one ninth of the total number.
Get the Weekly English Kit 📬
New words, one handy idiom, and a 2-minute quiz — delivered to your inbox to keep your streak alive.
 Related Questions