
IELTS ACADEMIC WRITING TASK 1
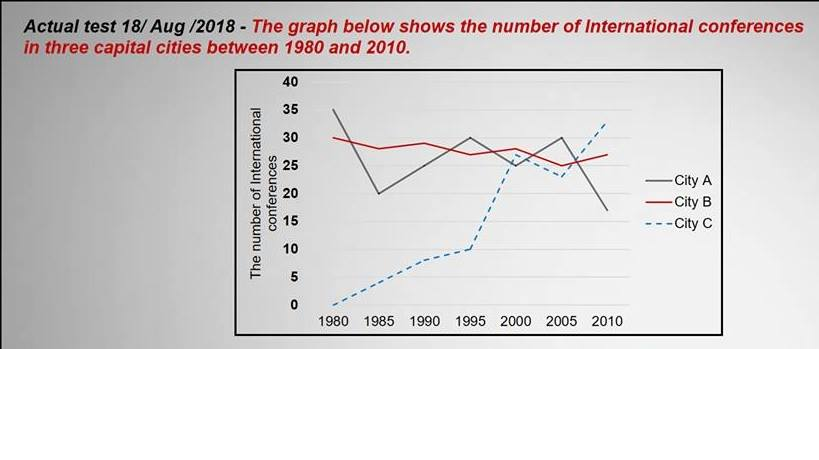
The given line chart illustrates the figure for global meetings measures in different capital cities during the period 1980 to 2010.
Overall, it is clear that there was a considerable fluctuation movement in the number of international conferences in three city centers over the 30 - year period. However, the increase in worldwide assemblies from city C was particularly significant.
In 1980, the global conferences did not appear in city C. There was a remarkable rise to a figure for 35 meetings by 2010, with a sharp increase between 1985 and 2000 and slight fall over next 5 years.
City A accounted for about 35 meetings in 1980. This figure fell dramatically to 20 meetings in 1985, and then fluctuate to around 15 meetings at the end of the period. Whereas city B witnessed a slow decline under 30 meetings throughout the period.
Top answer
) different capital cities during the period 1980 to 2010. Overall, it is clear that ("clear, obvious, apparent, evident" are opinion words. Do not write opinions in Task 1.
- ) different capital cities during the period 1980 to 2010.
- Overall, it is clear that ("clear, obvious, apparent, evident" are opinion words.
- Do not write opinions in Task 1.
- Task 1 shows your skills in accurately and precisely describing a figure or set of related figures that would appear in a mathematical or scientific context.
- ) there was a considerable fluctuation movement (wrong words) in the number of international conferences in the three city centers over the 30 - year period.
Get the Weekly English Kit 📬
New words, one handy idiom, and a 2-minute quiz — delivered to your inbox to keep your streak alive.
The given line chart illustrates the figure (wrong word) for global meetings measures (wrong words) in (How many?) different capital cities during the period 1980 to 2010.
Overall, it is clear that ("clear, obvious, apparent, evident" are opinion wor
 Related Questions