
IELTS
The line graph illustrates the information about how much fast food( including pizza, fish and chips, and hamburgers ) was eaten by Australian teenagers over a period of the 25 years (between 1975 and 2000)
overall, the number of people who had more demand in choosing pizza and hamburgers while the consumption of fish and chips show a downward trend
In the year 1975, there were appropriate 100 times annual in the consumption of fish and chips, making it hold the first rank, in comparison with the others this number declined slightly by 5 times in the 10 following year before a student rapid fall to under 40 times. In 2000, which was the best popular choice.
At the time, there were 10 times yearly Australian teenagers shaved they're interested in hamburgers, which was 5 times higher than that of pizza. In 1975 10 years later, he favors both kinds of convenient food was found in Australian teenagers. By 2000, the figure for hamburger rose gradually and reaching about 100times, which was similar to the first rank in 1975 while there was no significant change in that of pizza, stabling at 85 times for the week.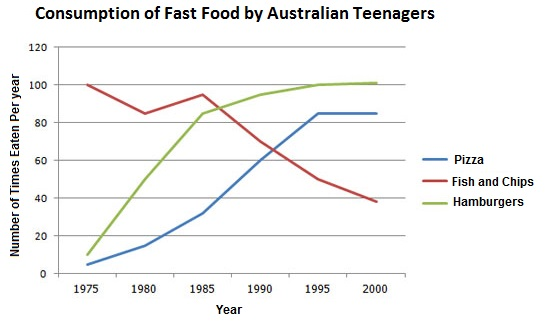
Top answer
The line graph illustrates the information about how much fast food( including pizza, fish and chips, and hamburgers ) was eaten by Australian teenagers over a period of the 25 years (between 1975 and 2000) overall, the number of people who people had more an increasingly high demand in for choosing pizza and hamburgers while the consumption of fish and chips show saw a downward trend In the year 1975, there were appropriate 100 times annual in the consumption of fish and chips were consumed 100 times annually , making it hold the first rank the most frequently eaten food , in comparison with the others this number declined slightly by 5 times in the 10 following years before a student sudden rapid fall to under 40 times. In 2000, which it was the best least popular choice. At the time At the beginning of the period , there were 10 times yearly Australian teenagers shaved they're interested in ate hamburgers, which was 5 times units (because everyone will think 5 times here means fivefold) higher than that the figure for of pizza.
- The line graph illustrates the information about how much fast food( including pizza, fish and chips, and hamburgers ) was eaten by Australian teenagers over a period of the 25 years (between 1975 and 2000) overall, the number of people who people had more an increasingly high demand in for choosing pizza and hamburgers while the consumption of fish and chips show saw a downward trend In the year 1975, there were appropriate 100 times annual in the consumption of fish and chips were consumed 100 times annually , making it hold the first rank the most frequently eaten food , in comparison with the others this number declined slightly by 5 times in the 10 following years before a student sudden rapid fall to under 40 times.
- In 2000, which it was the best least popular choice.
- At the time At the beginning of the period , there were 10 times yearly Australian teenagers shaved they're interested in ate hamburgers, which was 5 times units (because everyone will think 5 times here means fivefold) higher than that the figure for of pizza.
- In 1975 10 years later, he favors both kinds of convenient fast food was found witnessed an upward trend in their statistics.
- in Australian teenagers .
Get the Weekly English Kit 📬
New words, one handy idiom, and a 2-minute quiz — delivered to your inbox to keep your streak alive.
The line graph illustrates the information about how much fast food( including pizza, fish and chips, and hamburgers ) was eaten by Australian teenagers over a period of the 25 years (between 1975 and 2000)
overall, the number of people who people had more an increasingly high demand in for choosing pizza and hambu
The line graph illustrates the information about how much fast food (including pizza, fish and chips, and hamburgers) was eaten by Australian teenagers per year over a period of the 25 years (between 1975 and 2000).
 Related Questions