
I want to improve writing skill because I can not boost score from 6.0
The graph below shows people’s level of satisfaction with the health care system in 4 countries between 1991 and 2007. 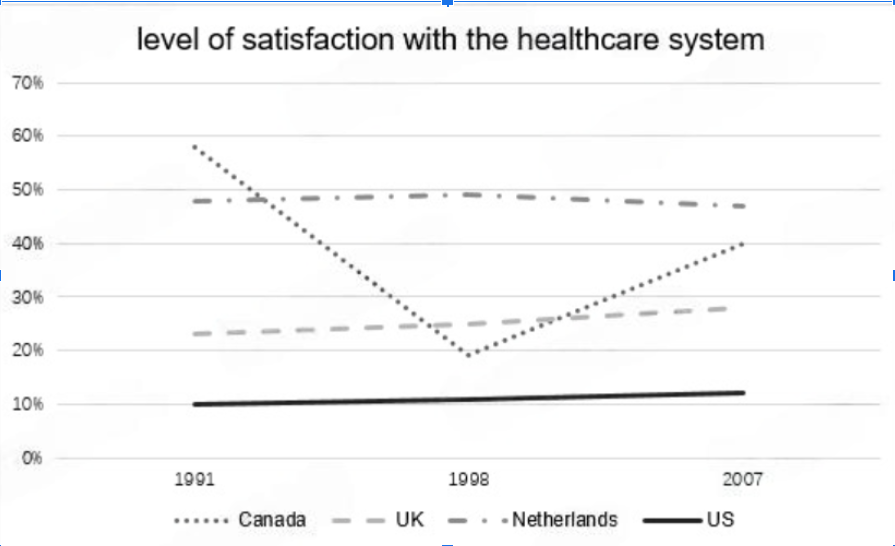
The provided graph compares four different countries in terms of the degree of contentment with the healthcare system from 1991 to 2007.
Overall, while the percentages of people satisfied with the healthcare system in the UK and the US increased, those in Canada and Netherland experienced a reverse trend. It is also clear that the US always had the lowest level of satisfaction from 1997 to 2001.
Regarding the US and the UK, in 1991, the degree of contentment with the healthcare system in the US(22%) is double the figure for the UK(10%). After 16 years,the level of satisfaction with the healthcare system in the UK experienced a slight rise, increasing to 12% in 2007. Similarly, people love the healthcare system in 2007 more than in 1991, which increased to 28% in 2007.
In terms of Canada and the Netherlands, in 1991, the percentages of people satisfied with the healthcare system in Canada and the Netherlands dominated, 59% and 49% respectively. This figure for Canada then hit the bottom of 19% before increasing to exactly 40% in 2007. The period 1991-2007 recorded a minimal decline in the proportion of the degree of contentment with the healthcare system , decreasing about 1% from 49% in 2007.
Get the Weekly English Kit 📬
New words, one handy idiom, and a 2-minute quiz — delivered to your inbox to keep your streak alive.
 Related Questions