
I really need your help to improve
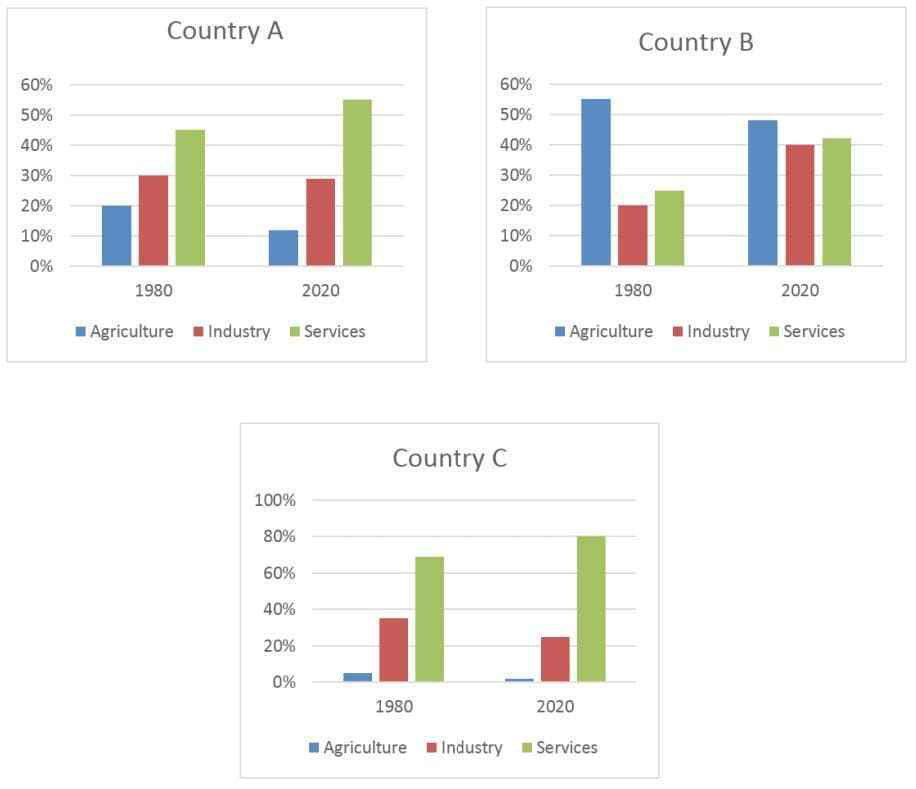
The bar charts compare the percentage of people working in three major sectors (Agriculture, Industry, Services) in three nations in 1980 with a forecast to 2020.
Overall, in the three countries, the proportions of people employed in services are projected to rise by 2020, whilst those percentages in Agriculture are set to decline by 2020.
In country A, agriculture accounted for the smallest percentage of people employed, with 11% projected in 2020, nearly half of its initial level. The rate of people working in industries started at 30% in 1980 and is predicted to be relatively static by 2020. As for services, starting out at 45% in 1980, the rate is envisaged to gain more than 10% in 2020.
Country B, in contrast, relies mostly on agriculture, with more than 50% people employed in 1980, roughly tenfold that of country C. By 2020, the rate is then projected to have a minor drop to approximately 48%, though still ten times higher compared with country C. Correspondingly, Both industries and services in country B will show 20 point rise till 2020, doubling their starting values.
Country C is mainly reliant on services. standing at 70% in 1980, the rate in services here is predicted to grow to 80% in 2020. This will be offset by a 9% decline in Industry (from 35% to 26%) and 1% in Agriculture( from 5% to 4%).
Drop here!Top answer
The bar charts compare the percentage of people working in three major sectors (Agriculture, Industry, Services) in three nations in 1980 with a forecast to 2020. (Incomplete. ) The three bar charts, labeled Country A, Country B and Country C, give the percentages of their working population employed in each of three major sectors (Agriculture, Industry and Services) at two points in time, actual numbers in 1980 and a forecast for 2020.
- The bar charts compare the percentage of people working in three major sectors (Agriculture, Industry, Services) in three nations in 1980 with a forecast to 2020.
- (Incomplete.
- ) The three bar charts, labeled Country A, Country B and Country C, give the percentages of their working population employed in each of three major sectors (Agriculture, Industry and Services) at two points in time, actual numbers in 1980 and a forecast for 2020.
- Overall, in the three countries, the proportions of people employed in services are projected to rise by 2020, whilst those percentages in Agriculture, they (Use a pronoun to avoid repetition) are set to decline by 2020 .
- (Avoid repeating) In country A, agriculture accounted for the smallest percentage of people employed, with 11% projected in 2020, nearly half of its initial level.
Get the Weekly English Kit 📬
New words, one handy idiom, and a 2-minute quiz — delivered to your inbox to keep your streak alive.
The bar charts compare the percentage of people working in three major sectors (Agriculture, Industry, Services) in three nations in 1980 with a forecast to 2020. (Incomplete. What are the three nations?)
The three bar charts, labeled Country A, Country B and Country C, give the percentages of their working population employe
 Related Questions