
I need some comments for my IELTS Task 1!!! Please help!!
Summarise the information by selecting and reporting the main features, and make comparisons where relevant.
- You should write at least 150 words.
- You should spend about 20 minutes on this task.
-----------------------------------------------------------------------------
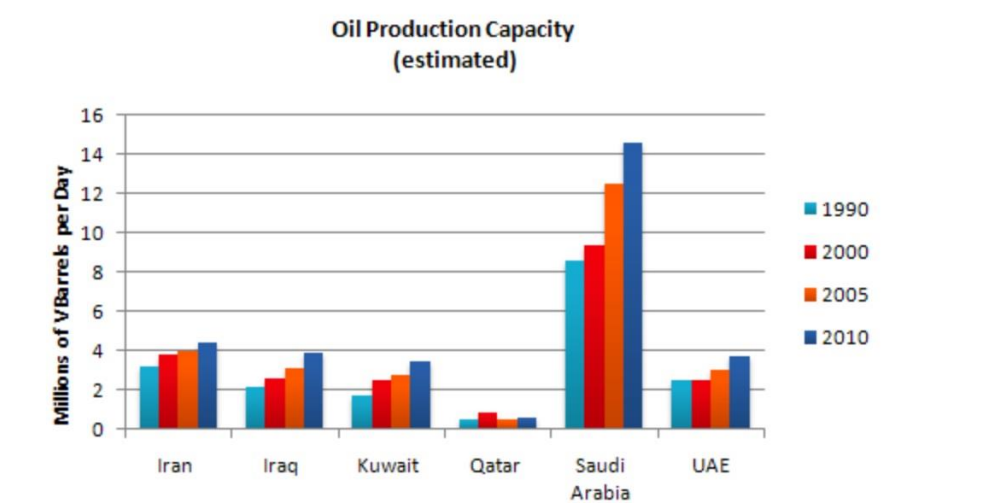
The bar chart gives information about the amount of oil produced by six different countries from 1990 to 2010, measured in millions of barrels per day.
Overall, it is obvious that oil production capacity tended to increase over 20-year period. While Saudi Arabia experienced the biggest growth, the amount of oil produced by Qatar did not change much between 1990 and 2010.
In 1990, Saudi Arabia was the manufacturer which produced the most barrels of oil ( more than eight million barrels per day). The figures for Saudi Arabia saw a significant increase, at more than 14 million barrels per day. By contrast, the figures for Qatar were the lowest, after some minor fluctuations the oil barrels produced by Qatar remained similarly, at under one million barrels per day.
From 1990 to 2010, there was a slight growth in oil production in the other four countries. Iraq, Kuwait and UAE had the approximate amount of oil production, about two million barrels per day, compared to three million barrels of Iran in 1990. Although, UAE did not see a change in 2000, its figure peaked at four million barrels in 2010, equal to the three other countries.
Top answer
The bar chart gives information about the amount of oi l-production capacity produced by of six different countries from 1990 to 2010, measured in millions of barrels per day. Overall, it is obvious that oil production capacity tended to increase over that 20-year period. While Saudi Arabia experienced the biggest growth, the amount of oil produced by Qatar did not change much between 1990 and 2010.
- The bar chart gives information about the amount of oi l-production capacity produced by of six different countries from 1990 to 2010, measured in millions of barrels per day.
- Overall, it is obvious that oil production capacity tended to increase over that 20-year period.
- While Saudi Arabia experienced the biggest growth, the amount of oil produced by Qatar did not change much between 1990 and 2010.
- In 1990, Saudi Arabia was the manufacturer country which produced the most barrels of oil (m ore than eight million barrels per day).
- After ten years, that rate increased modestly to around 9 million barrels per day.
Get the Weekly English Kit 📬
New words, one handy idiom, and a 2-minute quiz — delivered to your inbox to keep your streak alive.
The bar chart gives information about the amount of oil-production capacity produced by of six different countries from 1990 to 2010, measured in millions of barrels per day.
Overall, it is obvious that oil production capacity tended to increase over
 Related Questions