
I need feedback for ielts writing task 1
I am practicing to write task 1 in the Ielts test with one of my friend. We really need feedback for these two essays. Please help us ! 
The line chart shows average attendance at the cinema among various age groups in the US from 2000 to 2011.
A glance at the line chart provided reveals differences between the average attendance rates of various age groups in the US over the 11-year period from 2000 to 2011.
Overall, the highest attendance rate was attributed to people from 15 to 24 years old, while the polar opposite was true for the age group of 35 and over. In addition, all four figures of the four age groups grew up over time.
To begin with, the figure for the 15-24 age group rose sustainedly from 15% in 2000 to some 44% after nearly 6 years. After that, it fluctuated somewhere in the vicinity of 45% then increased to about 50% in 2007. Then, it reached a plateau at about 37% in 2008s before ascending in the remaining years. As for the 35-and-over age group, it climbed stably from approximately 0% in 2000 to around 12% in 2011.
As regards the two remaining figures, the one for 7-14 age group leaped to 30% in 2007s from 10% in 2000. Then it fell down slightly in 2008 before peaking at nearly 40% in 2010. Likewise, the figure for 25-35 age group climbed stably to around 25% in 2007, then dipped down about 5% in the subsequent year before peaking at around 32% in 2009s. After all, both figures showed downwards trend after their peaks.
------------------------
The provided line graph illustrates how the number of people among different ages going to the cinema was changed in the US during a 11-year period from 2000 to 2011.
Overall, a quick glance at the graph shows that all groups of people observed a significant fluctuation in the number of cinema goers. It is also noticeable that 15-24 was the most favorable age to attend the cinema, while humans aging 35 and over accounted for the least significant proportion among the four groups.
In 2000, there was only 1% of 35-year-old residents going to the cinema. This figure then went up steadily and stood at approximately 12% at the end of the period. In the meantime, 7-14 and 25-35 age group observed a startling parallel. These two figures respectively began at 10% and 3%, then simultaneously fluctuated to reach the same point, at 30% in 2011.
In sharp contrast, people aging 15-24 went to the cinema the most. In 2000, about 16% of cinema goers were 15-24 years old. During the next 10 years, this figure fluctuated dramatically and reached the peak at over 50% in 2011.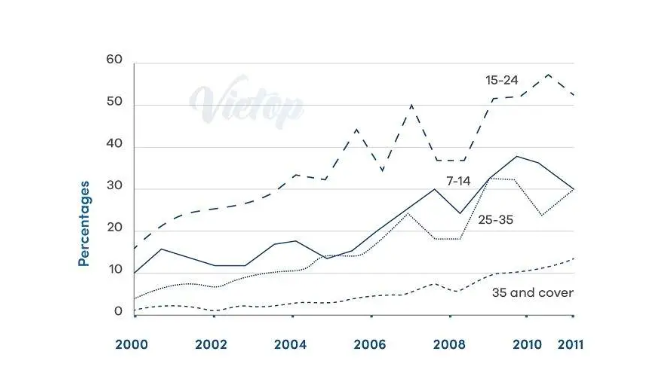
Top answer
Please post essays in the essay forum so a moderator does not have to move your post. htm Please read my advice for Task 1 essays: IELTS TASK 1: Hints, Tips And Advice Vocabulary Words For Task 1: Reference Post
- Please post essays in the essay forum so a moderator does not have to move your post.
- htm Please read my advice for Task 1 essays: IELTS TASK 1: Hints, Tips And Advice Vocabulary Words For Task 1: Reference Post
Get the Weekly English Kit 📬
New words, one handy idiom, and a 2-minute quiz — delivered to your inbox to keep your streak alive.
Please post essays in the essay forum so a moderator does not have to move your post.
https://www.englishforums.com/English/EssayReportCompositionWriting/Forum9.htm
Please read my advice for Task 1 essays:
A glance (That is bad, very bad! The maths professor wants you to study the graph very carefully so you can accurately report the information. A "glance" is just the opposite of a close study. ) at the line chart (There is no such thing as a line chart. There are pie charts, bar charts, eye
The provided (delete. unnatural) line graph illustrates (wrong word. Read my advice. Illustrate is not an appropriate verb for plots or tables of data. Use it for maps, flowcharts, and diagrams. Those figures are pictures. "Illustrate" means "show a picture of something." For plots you can use compare, plot, give, show and som
 Related Questions