
I need an evaluation
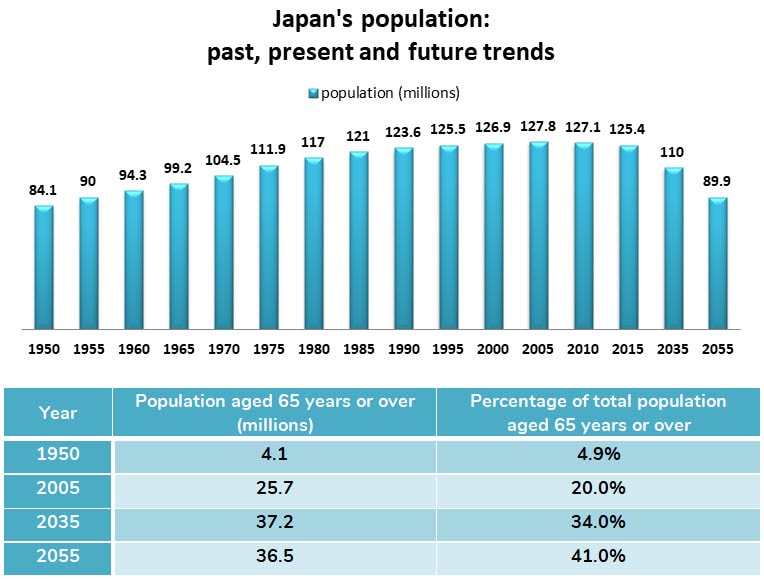
The given chart and table depict information about Japan's population in the past, present, and future. The chart reveals the population of Japan while the table below shows 65 years old or over in population and the proportion of the population who are more than 65 years old.
Overall, it can be clearly seen that the population of Japan increased dramatically but it is forecasted to undergo a significant upward trend. However, the proportion of the population is believed to be going higher when it comes to 2055.
Back in the day, the population in Japan experienced a drastic climb from 84,1 to 125,4 million between 1950 and 2015, and it is predicted that people living in Japan will be declining gradually between 110 to all the way down to approximately 90 million from 2035 to 2055.
When it comes to seniors, we can see that the percentage of the population who are 65 or older underwent a minor majority of roughly 5% to a small 20% from 1950 to 2005. In the future, there will be a vast majority of 34% to 41% between 2035 and 2055 in the proportion of the elderly in Japan.
Top answer
The given (Do not use "given", "provided" or similar modifiers. ) chart and table provide depict (wrong word) information about Japan's population in the past, present, and future. The chart (There are eye charts, pie charts, flow charts, Gantt charts, and organization charts.
- The given (Do not use "given", "provided" or similar modifiers.
- ) chart and table provide depict (wrong word) information about Japan's population in the past, present, and future.
- The chart (There are eye charts, pie charts, flow charts, Gantt charts, and organization charts.
- What kind is this one?
- ) reveals (wrong word) the population of Japan in five-year intervals from 1950 to 2035.
Get the Weekly English Kit 📬
New words, one handy idiom, and a 2-minute quiz — delivered to your inbox to keep your streak alive.
The given (Do not use "given", "provided" or similar modifiers. It is not natural.) chart and table provide depict (wrong word) information about Japan's population in the past, present, and future. The chart (There are eye charts, pie charts, flow charts, Gantt ch
 Related Questions