
Hope you can check it for me
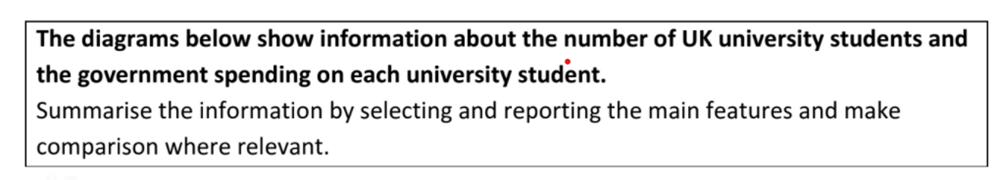
The three charts compare the quantity of university students in UK, the government expenditure on each students every year from 1997 to 2001 and the percentage of students by family earnings in 2001.
Overall, the number of university students increased whereas the spending on each of them decreased. In addition, most university students were from high income families.
Regarding the bar chart, in 1997, there were about 1.2 million students at university. The figure then rose progressively by about 1 million each year to reach the peak at about 1.9 million in 2000, before a slight fall at the end of the period . However , the line graph showed an opposite trend . The figure started at 600 pounds each student, then plummeted to bottom at around 150 pounds each and stayed stabilized from that time onwards.
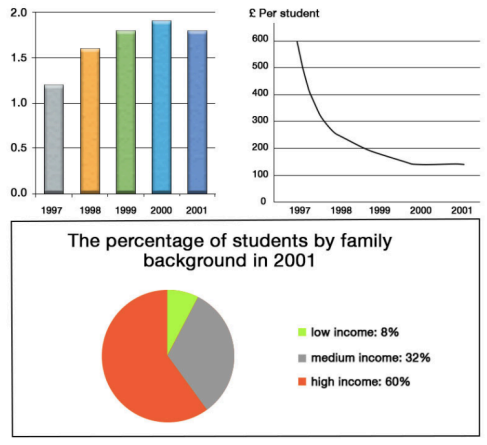
Looking at the pie chart, the largest percentage of students was from high – income families, occupying 60 %. The figure for high- income category doubled the percentage of the medium- income one while only a trivial percentage was for low – income one, accounting for only 8 percent.
Top answer
The three charts compare the quantity [ 1] number of university students in UK, the government expenditure on each [ 2] students student every year from 1997 to 200 1, and the percentage of students by according to family earnings income in 2001. Overall, the number of university students increase d, whereas the spending on each of them amount spent per student decreased. In addition, most university students were from hig h-i ncome families.
- The three charts compare the quantity [ 1] number of university students in UK, the government expenditure on each [ 2] students student every year from 1997 to 200 1, and the percentage of students by according to family earnings income in 2001.
- Overall, the number of university students increase d, whereas the spending on each of them amount spent per student decreased.
- In addition, most university students were from hig h-i ncome families.
- 2 million students at university in the UK .
- 9 million in 2000, before a slight fall at the end of the perio d.
Get the Weekly English Kit 📬
New words, one handy idiom, and a 2-minute quiz — delivered to your inbox to keep your streak alive.
The three charts compare the quantity [ 1] number of university students in UK, the government expenditure on each [ 2] students student every year from 1997 to 2001, and the percentage of students by
koanh1124in UK,
This should be in the UK. The names of some states need the before them when used in a sentence. Other examples include the USA and the Czech Republic.
 Related Questions