
HELT ME WITH THIS WRITING PLZZ! THANK YOU
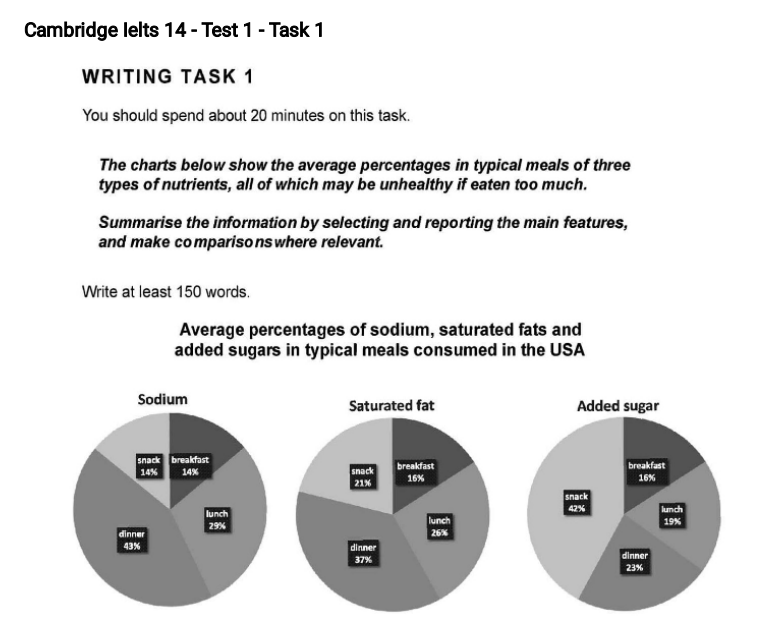
The shown pie charts give data on the consumption of average proportion of sodium, saturated sugar and added sugar in typical meals in the USA.
Initially, dinner is the meal which contains the largest proportion of sodium (at 43%) and saturated fat (at 37%). By contrast, the amount of sodium in breakfast and snacks is less than others, both at 14%. What is more, breakfast has the smallest amount of saturated fat (at 16%). Lunch is the second meal most sodium and saturated fat meal.
In addition, while the proportion of added sugar in snacks is the largest one (at 42%), breakfast contains lowest amount of added sugar (at 16%). As we can see, although dinner is the meal which has the largest proportion of sodium and saturated fat, it only contains 23% of added sugar.
Generally speaking, breakfast is the meal which is has the least percentage of sodium, saturated fat and added sugar.
Top answer
" How many pie charts? ") of sodium, saturated sugar and added sugar in typical meals in the USA. (Your paragraph is incomplete.
- " How many pie charts?
- ") of sodium, saturated sugar and added sugar in typical meals in the USA.
- (Your paragraph is incomplete.
- " Here are examples of opening paragraphs The three pie charts, labeled sodium, saturated fats and added sugar, show the percentage of daily intake of these ingredients in the three meals (breakfast, lunch and dinner) and snacks which make up the typical American diet.
- The three pie charts, one each for sodium, saturated fat, and added sugar, depict the proportion of daily intake of these nutrients distributed over four meals, breakfast, lunch, dinner and snacks.
Get the Weekly English Kit 📬
New words, one handy idiom, and a 2-minute quiz — delivered to your inbox to keep your streak alive.
The shown (Do not use "given, shown, above, or below to modify "chart." How many pie charts? ) pie charts give data on the consumption of average proportion (We do not eat "average proportions.") of sodium, saturated sugar and added sugar in typical meals in the USA. (Your paragraph is incomplete. You did not mention
 Related Questions