
Help me with writing task 1 - academic (2)
The graph below shows the average number of UK commuters travelling each day by car, bus or train between 1970 and 2030.
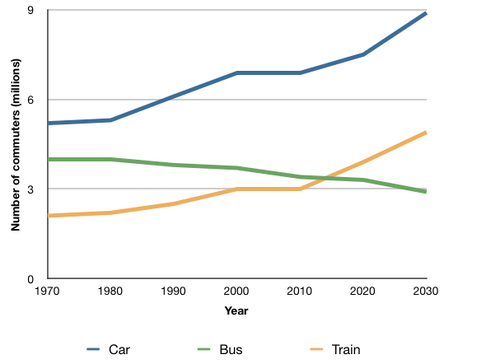
The line chart illustrates the number of people daily commuting on three types of different vehicles in Britain from 1970 to 2030.
Overall, there is a significant increase in travelling by cars and trains whereas UK commuters have a tendency to go by buses less and less, with equal travelling by buses and trains on average in the middle of the year 2010 and 2020.
In detail, in the first year of the period, the number of the British using trains to travel each day was about 2 millions, while above 3 millions people chose to go by buses and cars, at 4 and 5 millions respectively. From 1970 to 2020, there was a steady linear incline in UK commuters travelling by trains and cars, with above 7 millions of people commuting on cars every day in 2020, which accounted for the highest rate of three value, and reaching 9 millions of people in 2030.
In contrast, the number of people going by buses went slightly down, by 1,000,000 commuters over a 60-year period. In 2015, 3.5 millions UK people used trains to commute as same as the ones commuting on the buses.
Top answer
I just gave feedback on this same task 1 for another student. You make the same mistakes. I will copy some of my comments from it.
- I just gave feedback on this same task 1 for another student.
- You make the same mistakes.
- I will copy some of my comments from it.
- htm ngocla The line chart illustrates There is a bar chart, a pie chart, an eye chart, an organization chart and a flow chart.
- There is no such thing as a line chart .
Get the Weekly English Kit 📬
New words, one handy idiom, and a 2-minute quiz — delivered to your inbox to keep your streak alive.
I just gave feedback on this same task 1 for another student. You make the same mistakes.
I will copy some of my comments from it.
https://www.englishforums.com/English/CouldReviewEssay/bpkkmp/post.htm
ngoclaThe line
The line chart illustrates the number of people daily commuting daily by on three types of different
 Related Questions