
Help me with writing task 1 - academic
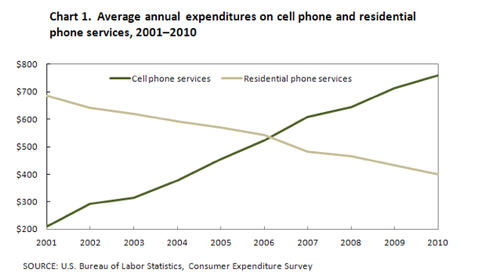
The graph below shows US consumers' average annual expenditures on cell phone and residential phone services between 2001 and 2010.
Write a report for a university, lecturer describing the information shown below.
Summarise the information by selecting and reporting the main features and make comparisons where relevant.
You should write at least 150 words.
The chart gives information about the number of money that the US people yearly spend on mobile phone and landline services over the 10-year period.
It can be clearly seen that while there was a gradual decrease in residental phone services, American spent significantly the large number of money on their cell phone. In 2006, US customers spent the same money on both cell phone and residential phone.
In 2001, people spent nearly 700 USD on the landline, which was over three times in compared to on the cell phone, by at around 200 USD. In the first 5-year period, customers spent twice on their mobile phone, by at 500 USD, whereas there were a slight fall of the residential services from under 700 USD to about 600 USD.
Looking at the middle year, people in the US spent around 550 USD on their mobile phone which was the same amount of money spending on the residential services. In the 4 years later, the highest number of dollars spent on cellphone was above 750 USD in 2010. In the same year, the landline services stood the lower, which was at about 400 USD.
Top answer
The chart gives information about the number shows the amount of money that the people in the US people yearly spend spent on average on mobile phone and landline services per year over the 10 a ten- y ear period starting in 2001 . It can be clearly seen that while there was a gradual decrease in spending on resident i al phone services, American spent significantly the large number of money on their the opposite was true for cell [ 1] phon e s . In 2006, US customers spent the same money on both cell phone and residential phone.
- The chart gives information about the number shows the amount of money that the people in the US people yearly spend spent on average on mobile phone and landline services per year over the 10 a ten- y ear period starting in 2001 .
- It can be clearly seen that while there was a gradual decrease in spending on resident i al phone services, American spent significantly the large number of money on their the opposite was true for cell [ 1] phon e s .
- In 2006, US customers spent the same money on both cell phone and residential phone.
- In 2001, people spent nearly 700 USD on the landline calls , which was over three times in c ompared to the amount spent on mobile calls (200 USD).
- the cell phone, by at around 200 USD.
Get the Weekly English Kit 📬
New words, one handy idiom, and a 2-minute quiz — delivered to your inbox to keep your streak alive.
The chart gives information about the number shows the amount of money that the people in the US people yearly spend spent on average on mobile phone and landline services per year over
 Related Questions