
HELP ME WITH MY IELTS WRITING TASK 1. THANK YOU A LOT
The chart below shows the percentage of households in owned and rented accommodation in England and Wales between 1918 and 2011.
Summarise the information by selecting and reporting the main features, and make comparisions where relevant.
The bar chart illustrates the proportion of English and Welsh households with and without accommodation from 1981 to 2001.
Overall, it is noticed that households in temporary accommodation is significantly higher than households in owned accommodation on the first half of the period. However, on the second half of the timescale, owned accommodation replaced rented one to become preference of family in England and Wales.
With regard to households in rented accommodation, they accounted for around 75% in 1918, this proportion then dropped dramatically to 50% in 1971 before reaching the bottom of just over 30% in 2001. Despite the drop, it managed to slightly recover to 35% 10 years after 1971.
On the other hand, initially families living in owned house were minorities, at around 22% in 1918. This trend generally rose for the next 53 years with the year 1918 when with-accommodation households overtook households living in rented accommodation in percentage terms, at 60% and 40% respectively.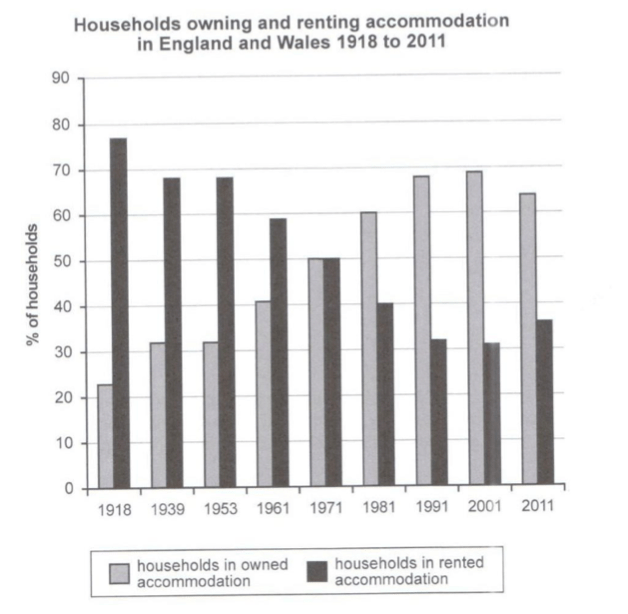
Top answer
Please refer to my model essay posted in this thread. htm Your writing is very careless. You need to pay very close attention to the values in the plots and graphs in Task 1.
- Please refer to my model essay posted in this thread.
- htm Your writing is very careless.
- You need to pay very close attention to the values in the plots and graphs in Task 1.
- The bar chart illustrates (Wrong word.
- "Illustrate" means "make a picture" Use this word for maps, process charts and diagrams, not for charts and graphs.
Get the Weekly English Kit 📬
New words, one handy idiom, and a 2-minute quiz — delivered to your inbox to keep your streak alive.
Please refer to my model essay posted in this thread.
https://www.englishforums.com/English/WritingTask1AChart/bnzkgr/post.htm
Your writing is very careless. You need to pay very close attention to the values in the plots and graphs in Task 1.
 Related Questions