
Help me with ielts writing task 1
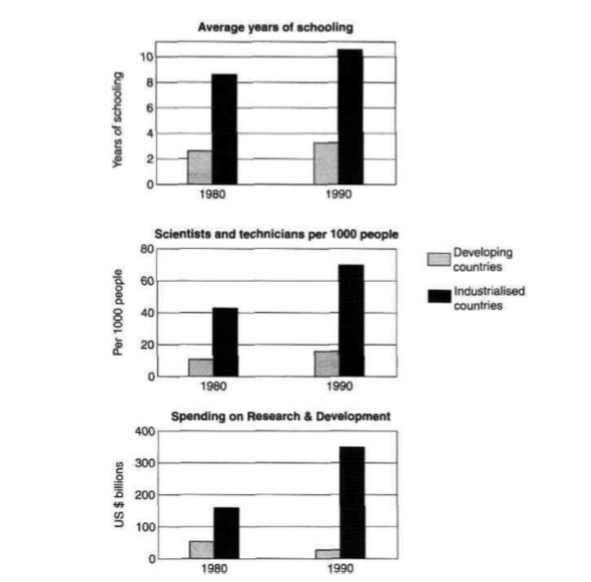
The three bar charts show changes in the years of schooling, the number of scientists and technicians, and the amount of money for research and development in rich and poor countries between 1980 and 1990.
It is evident that the levels of participation in education and science in industrialized nations were much higher than developing nations. Besides that, the charts show an overall increase in both types of country during the 10-year period.
From 1980 to 1990, in developing countries most of people had about 3 years at school and that number rose approximately to 4 years in the end of period. On the other hand, the figure for developed countries increased form nearly 9 to nearly 11 at the same time.
In rich nations, the two figures for scientists and technicians and spending on research and development almost doubled after 10 years. By contrast, the number of science workers in poor nations remained below 20 per 1000 people and spending on research and development saw a gradual fall, reached a bottom at 20 billion dollars in 1990.
Thanks for reading!
Top answer
The three bar charts show changes in the years of schooling, the number of scientists and technicians, and the amount of money for research and development in rich and poor countries at two different times — between 1980 and 1990. It is evident that the levels of participation in education and numbers of scientists science in industrialized nations were much higher than in developing nations. Besides that, the charts show an overall increase in both types of country during the 10-year period.
- The three bar charts show changes in the years of schooling, the number of scientists and technicians, and the amount of money for research and development in rich and poor countries at two different times — between 1980 and 1990.
- It is evident that the levels of participation in education and numbers of scientists science in industrialized nations were much higher than in developing nations.
- Besides that, the charts show an overall increase in both types of country during the 10-year period.
- From 1980 to 1990, in developing countries most of people had about 3 years at school and that number rose approximately to 4 years in the end of period.
- On the other hand, the figure for developed countries increased form nearly 9 to nearly 11 at the same time.
Get the Weekly English Kit 📬
New words, one handy idiom, and a 2-minute quiz — delivered to your inbox to keep your streak alive.
The three bar charts show changes in the years of schooling, the number of scientists and technicians, and the amount of money for research and development in rich and poor countries at two different times — between 1980 and 1990.
It is evident that the levels of participation in education and numbers of scientists science in indu
 Related Questions