
Help me to correct - Task 1
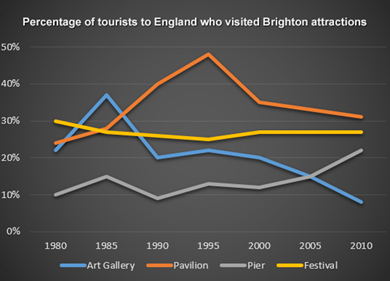
The line graph compares the percentage of travelers to England who came over four fascinating places in Brighton from over the period of 30 years.
It is clear that Pavilion was by far the most attractive place over the period shown. By 2005, Pier was the least attractive area for foreign visitors.
In 1980, there was around 20 to 30 percent of foreign tourists visited Art Gallery, Pavilion and Festival while this figure for Pier was just around 10 percent. Five years later, the percentage of tourist who went to Art Gallery rose dramatically to a high of 38 percent – the highest rate at that time.
Between 1985 and 2010 saw the suddenly decline of the foreign visitors rate to Art Gallery, by 2010 only 10 percent of foreign visitors came this place. By contrast, the proportion of foreign visitors to Pavilion increased significantly and peaked at 48 percent. The foreign visitor rate to Pier and Festival remained relative stable before this figure for Pier slightly increased to just over 20 percent in 2010.
Top answer
The line graph compares the percentage of travelers to England who came over (wrong word) four fascinating places in Brighton from over the (wrong word) period of 30 years. It is clear that Pavilion was by far the most attractive place over the period shown (What about 1980 and 1985? ) .
- The line graph compares the percentage of travelers to England who came over (wrong word) four fascinating places in Brighton from over the (wrong word) period of 30 years.
- It is clear that Pavilion was by far the most attractive place over the period shown (What about 1980 and 1985?
- ) .
- By (wrong word) 2005, Pier was the least attractive area for foreign visitors.
- In 1980, there was around 20 to 30 percent of foreign tourists (missing word) visited Art Gallery, Pavilion and Festival while this figure for Pier was just around 10 percent.
Get the Weekly English Kit 📬
New words, one handy idiom, and a 2-minute quiz — delivered to your inbox to keep your streak alive.
The line graph compares the percentage of travelers to England who came over (wrong word) four fascinating places in Brighton from over the (wrong word) period of 30 years.
It is clear that Pavilion was by far the most attractive place over the period shown (What about
 Related Questions