
Help me to correct
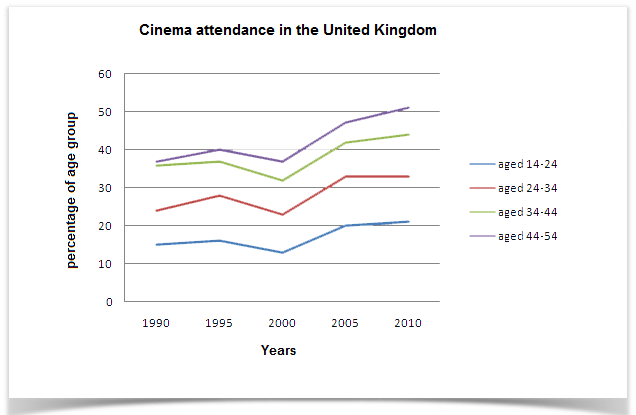
The line graph compares the percentage of British cinema attendees in 4 age groups over a period of 20 years.
It is noticeable that all 4 trends saw a similar change over the period shown and the cinema was more popular among older persons than any other age group.
In 1990, over 35 percent of people who aged from 34 to 54 years old went to the cinema while this figure for age group 14-24 and 24-34 were a mere around 15 and 23 percent respectively. By 1995 those numbers for all age groups had increased slightly before dropped to initial points or even lower in 2000.
From 2000 to 2010, the number of cinema attendees rose dramatically at all ages. To be precise, more than a half of the oldest age group went to the cinema in 2010 whereas this number for the youngest people was a bit higher than 20 percent. By contrast, around 43 percent of persons who aged 34-44 years old was cinema attendee – over 10 percent higher than that in 24-34 age group.
Get the Weekly English Kit 📬
New words, one handy idiom, and a 2-minute quiz — delivered to your inbox to keep your streak alive.
 Related Questions