
Help me correct with writing task 1
Leisure time in a typical week by sex and employment status 1998-1999.
The bar chart illustrates the number of spare time which was enjoyed by people in a typical week in diffirent gender and employment status between 1998 and 1999.
Overall, men took more leisure time than women ( except for men who hard part time jobs and house husbands). The amount of time enjoyed by unemployed people and retired people was significantly higher than the figures for the others.
For people who had full time jobs, men spent 44 hours per week on leisure pursuits, compared with 38 hours for women. The gender gap was clearly seen in people working part-time, where female spent 40 hours a week engaged in leisure activities, while the figure for male was 0 hours.
Unemployed female and women who were retired enjoyed the same amount of leisure time with 78 hours per week, whereas the figures for men retired and unemployed were 83 hours and 85 hours respectively. While housewives gave 50 hours to spare-time activities, there was no figure for house husbands.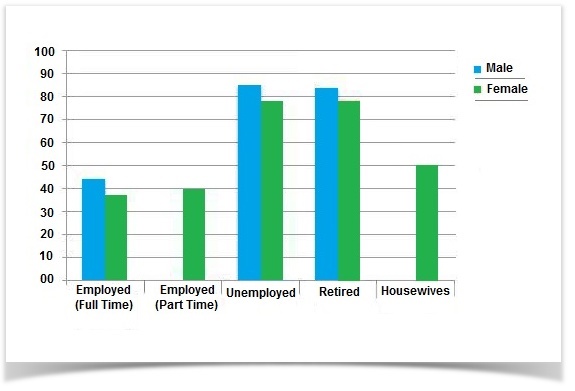
Top answer
The bar chart illustrates the number of spare time (Time is not countable. ) which was enjoyed by people in a typical week in diffirent gender and employment status between 1998 and 1999. ) and house husbands).
- The bar chart illustrates the number of spare time (Time is not countable.
- ) which was enjoyed by people in a typical week in diffirent gender and employment status between 1998 and 1999.
- ) and house husbands).
- The amount of time enjoyed by unemployed people and retired people was significantly higher than that enjoyed by working people.
- the figures for the others .
Get the Weekly English Kit 📬
New words, one handy idiom, and a 2-minute quiz — delivered to your inbox to keep your streak alive.
The bar chart illustrates the number of spare time (Time is not countable. A number of time makes no sense.) which was enjoyed by people in a typical week in diffirent gender and employment status betw
 Related Questions