
Help me correct my writing task 1.
The given line graph compares four distinct Brighton tourist attractions in England in terms of their proportion of travelers over the course of three decades.
Looking at the illustration, it is immediately evident that all categories experienced a downward trend, with the exception of the the Pavilion and the Pier. Another key features is that the Pier registered the lowest figures in most years.
It can be seen from the graph that in the year 1980, the percentage of people visiting the Brighton festival stood at 30%, compared with approximately 21% that of the Art Gallery. After 30-year period of fluctuating decrease, the proportion of visitors going to the Festival was roughly 21% in 2010. A different pattern was seen in the Art Gallery, whose figure rose steadily to about 37% at the beginning 5 years before soaring considerably to under 10% in the remaining years.
In the same 30-year period surveyed, other attractions in Brighton followed increasing pattern. Stood at almost 22% in 1980, the percentage of tourists paying a visit to the Pavilion climbed steeply and hit the peak at nearly 50% in the year 1995, followed by a gradual decline of around 20% 15 years later. The period between 2015 and 2030 also witnessed a light growth to almost 22% in the figure of the Pier, about 10% lower than that of the Pavilion.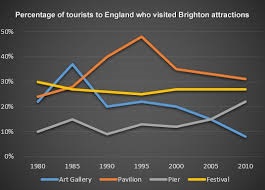
Top answer
Please read my advice for Task 1 essays. After reading this advice, edit your essay and post it again. You have many mistakes in vocabulary usage.
- Please read my advice for Task 1 essays.
- After reading this advice, edit your essay and post it again.
- You have many mistakes in vocabulary usage.
- The given line graph compares four distinct Brighton tourist attractions in England in terms of the percentage of tourists visiting the country who came to that destination.
- their proportion of travelers over the course of three decades .
Get the Weekly English Kit 📬
New words, one handy idiom, and a 2-minute quiz — delivered to your inbox to keep your streak alive.
Please read my advice for Task 1 essays.
After reading this advice, edit your essay and post it again. You have many mistakes in vocabulary usage.
The given line graph compares four distinct Brighton tourist attractions in England in terms of the percentage of tourists visiting the country who came to that destination.
 Related Questions