
Help me correct my IELTS writing task 1
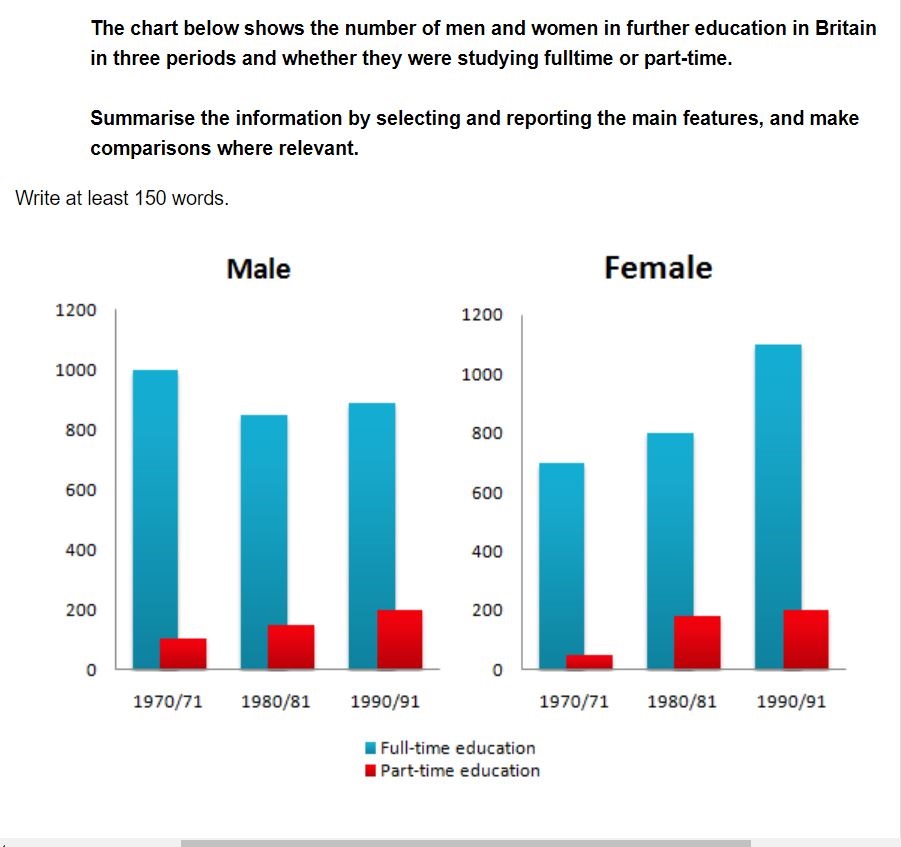
The bar graph compares the figures for British males and females who studied fulltime or part-time in further education from 1970/71 to 1990/91.
Overall, in further education, the number of fulltime and part-time female students went up year by year, while just only part-time male students had the increasing numbers. The closer our modern life came, the more women spent time on studying.
In fulltime further educational setting, there were 1000 male students but only 700 females in 1970/71. As time passed by, the number of female students steadily rose in 1980/81 and significantly jumped to its peak at 1100 in 1990/91. In constrast, the figures for men joining in this fluctuated but then slightly fell to 900 in the last stage, which was even 200 lower than women’s.
When it came to part-time, 1000 males and 35 females studied in this in 1970/71. The number of female students in 1980/81 sharply increased almost six times compared to 1970/71’s then slowly rose to 200 in 1990/91. Likewise, male students had the growing number until it peaked at 190 in the last decade.
Top answer
The bar graph compares the figures (Wrong word - numbers) for British males and females who studied fulltime or part-time in further education from 1970/71 to 1990/91. (wrong expression) You need to describe this better. Model: The two bar charts, one labelled Male and the other Female, compares the numbers of each gender that were enrolled in first, part-time, and second, full-time, tertiary education in Britain during three different time periods.
- The bar graph compares the figures (Wrong word - numbers) for British males and females who studied fulltime or part-time in further education from 1970/71 to 1990/91.
- (wrong expression) You need to describe this better.
- Model: The two bar charts, one labelled Male and the other Female, compares the numbers of each gender that were enrolled in first, part-time, and second, full-time, tertiary education in Britain during three different time periods.
- The time periods are two consecutive years ten years apart, 1970/1, 1980/1, and 1990/1.
- Overall, in further education, the number of fulltime and part-time female students went up over this period.
Get the Weekly English Kit 📬
New words, one handy idiom, and a 2-minute quiz — delivered to your inbox to keep your streak alive.
The bar graph compares the figures (Wrong word - numbers) for British males and females who studied fulltime or part-time in further education from 1970/71 to 1990/91. (wrong expression)
You need to describe this better.
Model:
The two bar charts, one labelle
 Related Questions