
Hello, this is the hardest ielts task 1 test i have ever seen. Thank you for checking the mistakes and help me improve my writing ;)
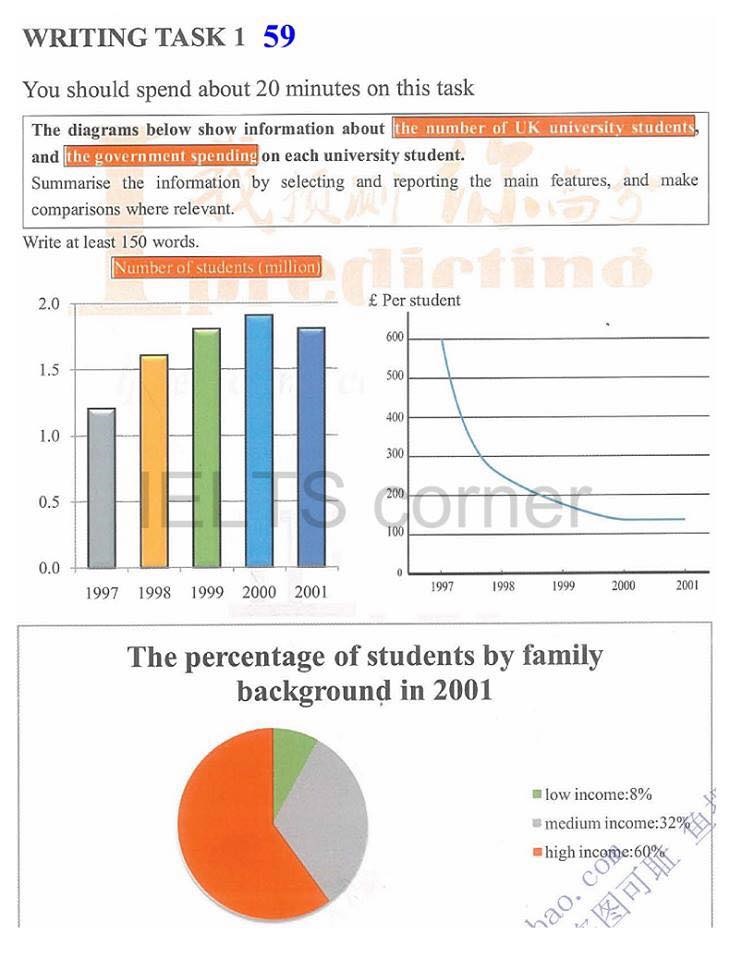
The charts below illustrate the changes of the amount of money spent by government on each university student as well as the number of students enrolling in UK universities.
Overall, while the number of UK university students increased between 1997 and 2001 before dipping slightly in 2001, there was a downward trend in the government spending in the period of 5 years. However, students being in high-income families held the largest share of ....... (can you help me to write the rest)
As we can see from the first diagram, the number of UK university students rose steadily from about 1.2 million to just under 2.0 million over 4 years. However, this figure declined minimally to roughly 1.7 million in 2001. By contrast, the amount of money spent by government on each university student decreased considerably from UM600 to approximately UM150 in the period of 5 years. The proportion of students living in high-income families soaked up the pie chart with the rate of 60%, while that of students coming from low-income families was the lowest at 8%.
Top answer
It is a challenging task because there are three different, but related diagrams: a pie chart, a line graph, and a bar chart. The charts below illustrate the changes in the amount of money spent by (missing word) government on each university student as well as the number of students enrolling (wrong form) in UK universities. Overall, while the number of UK university students increased between 1997 and 2001 before dipping slightly in 2001, there was a downward trend in the government spending over the period of 5 years.
- It is a challenging task because there are three different, but related diagrams: a pie chart, a line graph, and a bar chart.
- The charts below illustrate the changes in the amount of money spent by (missing word) government on each university student as well as the number of students enrolling (wrong form) in UK universities.
- Overall, while the number of UK university students increased between 1997 and 2001 before dipping slightly in 2001, there was a downward trend in the government spending over the period of 5 years.
- However, students being in from high-income families held the largest share of .......
- (can you help me to write the rest) accounted for 6 of every 10 university students in 2001.
Get the Weekly English Kit 📬
New words, one handy idiom, and a 2-minute quiz — delivered to your inbox to keep your streak alive.
It is a challenging task because there are three different, but related diagrams: a pie chart, a line graph, and a bar chart.
The charts below illustrate the changes in the amount of money spent by (missing word) government on each university student as well as the number of students enrolli
 Related Questions