
Hello teachers, this is an Ielts writing task 1 i've just written. Thanks for checking my mistakes and giving me advices :)
TOPIC: The chart below shows the worldwide use of different kinds of information and communication technology from 1998 to 2008.
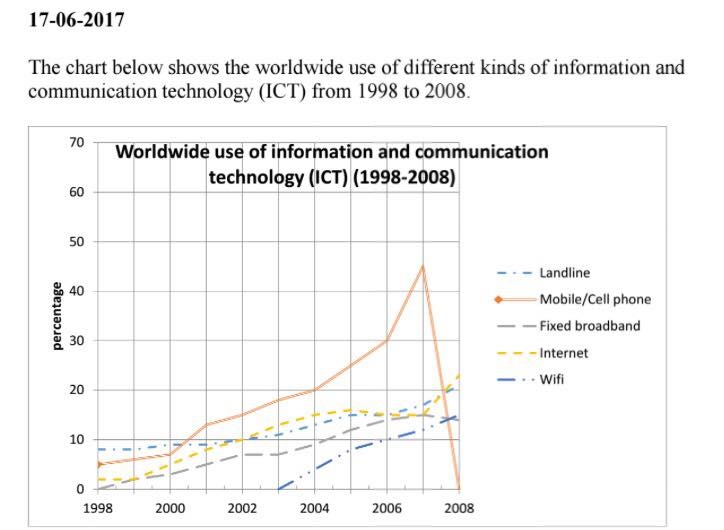
The graph below illustrates the global use of various types of information and communication technology between 1998 and 2008.
Overall, there was an upward trend in the percentage of all kinds of information and interaction method between 1998 and 2006. While the figure for all types kept rising in 2008, that for mobile and cell phone decreased rapidly at the end of the period of 10 years.
Standing at about 5% in 1998, the proportion of pottable phone used for information and communication rose considerably from 1998 to 2006 before peaking at roughly 45% in 2007. However, this figure declined markedly to 0% in 2008. Meanwhile, the percentage of landline, internet used for interaction and news went up dramatically from under 10% to approximately 20% between 1998 and 2008. That of fixed broadband also increased from 0% to about 15% in 2008. Nevertheless, wireless network was just invented in 2003 but the percentage of it used globally for communication and information climbed to the same figure of fixed broadband in 2008.
Top answer
The graph below illustrates the global use of various types of information and communication technology between 1998 and 2008. Note: The chart tells us about types of equipment such as cables and wires, networks, and wireless and wired phones. It does not tell us specifically what this equipment was used for.
- The graph below illustrates the global use of various types of information and communication technology between 1998 and 2008.
- Note: The chart tells us about types of equipment such as cables and wires, networks, and wireless and wired phones.
- It does not tell us specifically what this equipment was used for.
- "ICT" is just a general name for this kind of equipment.
- The Y-axis is percentage, but there is no information about what the base is.
Get the Weekly English Kit 📬
New words, one handy idiom, and a 2-minute quiz — delivered to your inbox to keep your streak alive.
The graph below illustrates the global use of various types of information and communication technology between 1998 and 2008.
Note: The chart tells us about types of equipment such as cables and wires, networks, and wireless and wired phones. It does not tell us specifically what this equipment was used for. "ICT" is just a general name for this kind of equipment. The Y-axis is
 Related Questions