
Hello. Please review my IELTS essay task 1. Thank you!
Topic: The chart below shows the unemployment rate and the number of people leaving Ireland from 1988 to 2008.
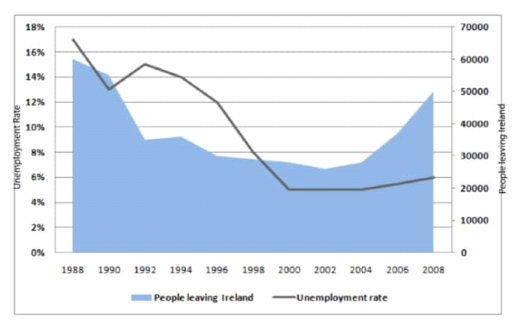
The chart illustrates the percentage of people unemployed and the number of people who left Ireland from 1988 to 2008.
Overall, there was a relative correlation between the two indicators. More people left Ireland when the unemployment rate was high and vice versa.
In 1988, 60.000 people moved out of Ireland, synchronizing with a high rate of unemployment of 17%. The next two years, there was a sharp decrease in the unemployment rate by 4%, at the same time, the number of people leaving Ireland also went down to 55.000. However, the two indicators turned to an opposite trend from 1990 to 1994. While the unemployment rate grew to 15% in 1992 and then fell back to 14% in 1994, the number of people leaving Ireland dropped significantly by 4% before slightly went up to 35.000 in 1994.
Both indicators decreased in the next 8 years with the unemployment rate dropped more remarkably by two-thirds, reaching a low figure of 5%. There was a more slight decrease in the number of people who left Ireland, it reached a bottom of 25.000 in 2002. In the last 6 years, it rose rapidly to reach 50.00, twice the number in 2002. In contrast, the unemployment rate only increased by 1%, finishing at 6% in 2008.
Top answer
) the unemployment rate percentage of people unemployed and the number of people who left Ireland from 1988 to 2008. Overall, there was a relative positive correlation between the two variables / curves indicators . More people left Ireland when the unemployment rate was high and vice versa.
- ) the unemployment rate percentage of people unemployed and the number of people who left Ireland from 1988 to 2008.
- Overall, there was a relative positive correlation between the two variables / curves indicators .
- More people left Ireland when the unemployment rate was high and vice versa.
- ) with a high rate of unemployment of 17%.
- 000.
Get the Weekly English Kit 📬
New words, one handy idiom, and a 2-minute quiz — delivered to your inbox to keep your streak alive.
The chart (wrong word.) illustrates (wrong word.) the unemployment rate percentage of people unemployed and the number of people who left Ireland from 1988 to 2008.
Overall, there was a relative
The chart illustrates the percentage of people unemployed and the number of people who left Ireland from 1988 to 2008.
Overall, there was a relative correlation between the two indicators. More people left Ireland when the unemployment rate was high and vice versa.
In 1988, 60.000 people moved out of Ireland, synchronizing with a high rate of unemployment of 17% -->
 Related Questions