
Hello. Please review my IELTS essay task 1. Thank you!
Topic: The line graph shows the number of trips to other countries by UK residents for various purposes between 1989 and 2001.
My essay:
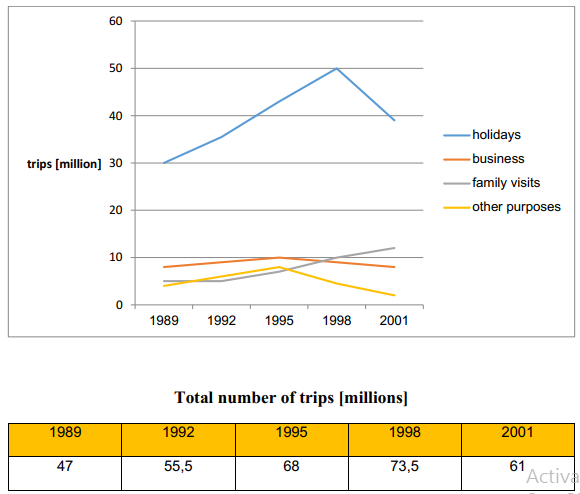
The line graph compares the reasons for traveling to other countries by UK citizens in 3-year intervals from 1989 to 2001. The table shows the total number of trips in the same period.
Overall, the total number of trips went up from 1989 to 1998 and then declined sharply in 2001. Traveling for holidays in the most popular reason throughout the period.
There was a dramatic increase in the number of trips for holidays in the first nine years, reaching a peak of 50 million in 1998. However, the number of holiday trips dropped significantly by 2001, finishing at 39 million.
While the number of trips for holidays was always above 30 million, the number of trips for other purposes was mostly below 10 million. Business trips and trips for other purposes shared a similar trend which gradually rose over the first six years and then turned to a downtrend for the rest of the period. The figures for ‘business’ and ‘other purposes’ were 8 million and 4 million respectively in 1989 and finished at 8 million and 1 million respectively in 2001.
In contrast, the number of trips to visit families grew over the period, beginning at 5 million and gradually increased to 12 million.
Top answer
The line graph compares the reasons for traveling (Incorrect. ) to other countries by UK citizens in 3-year intervals from 1989 to 2001. The table shows the total number of trips, starting in 1989 and every three years afterwards, ending in 2001.
- The line graph compares the reasons for traveling (Incorrect.
- ) to other countries by UK citizens in 3-year intervals from 1989 to 2001.
- The table shows the total number of trips, starting in 1989 and every three years afterwards, ending in 2001.
- in the same period.
- Overall, the total number of trips went up from 1989 to 1998 and then declined sharply in 2001.
Get the Weekly English Kit 📬
New words, one handy idiom, and a 2-minute quiz — delivered to your inbox to keep your streak alive.
The line graph compares the reasons for traveling (Incorrect. The line graph shows numbers, not reasons.) to other countries by UK citizens in 3-year intervals from 1989 to 2001. The table shows the total number of trips, starting in 1989 and every three years afterwards, ending in 2001.
 Related Questions