
Feedback for IELTS Writing Task 1
9 days left, I am so nervous now damn it!
------------------------------------
The graph below shows the proportion of four different materials that were recycled from 1982 to 2010 in a particular country.
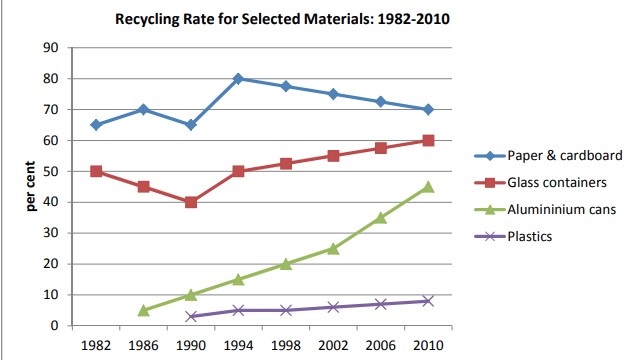
The line graph compares the recycling percentage of four different materials: paper & cardboard, glass containers, aluminum cans, plastics during the period from 1982 to 2010 in a country.
Overall, the recycling rates of all four materials increased at the end of the period. Paper and cardboard had the greatest proportion of recycled materials while plastics remained the lowest throughout the period.
In 1982, 65% of paper & cardboard were recycled. This proportion varied between 65% and 70% from 1982 to 1990 before reaching its peak of 80% in 1994. From then, recycling rate dropped gradually to 70% in 2010. Meanwhile, half of glass containers were recycled in 1982. From then, this number decreased, reaching the lowest point of 40% in 1990. It climbed back to 50% in 1994 and then continued to rise moderately until it reached 60% in 2010.
Aluminum cans were first recyled in 1986, starting at 5%. During the 1986-2002 period, there was a gradual increase of 20% in this proportion, after which it rose rapidly to 45% in 2010. Plastics, however, were not recycled until 1990, when just 3% of them were recycled. This rate increased very slowly, finished at almost 10% in 2010.
Top answer
The line graph compares the recycling percentage in a certain country of four different materials: paper & cardboard, glass containers, aluminum cans, plastics during the period from 1982 to 2010 in a country. Overall, the recycling rates of all four materials increased at the end of the period . (That is not true.
- The line graph compares the recycling percentage in a certain country of four different materials: paper & cardboard, glass containers, aluminum cans, plastics during the period from 1982 to 2010 in a country.
- Overall, the recycling rates of all four materials increased at the end of the period .
- (That is not true.
- g.
- ) Paper and cardboard had the greatest proportion (That makes no sense.
Get the Weekly English Kit 📬
New words, one handy idiom, and a 2-minute quiz — delivered to your inbox to keep your streak alive.
The line graph compares the recycling percentage in a certain country of four different materials: paper & cardboard, glass containers, aluminum cans, plastics during the period from 1982 to 2010 in a country.
Overall, the recycling rates of all four materials increased at the end of the period
Sample essay
The graph compares the recycling rates of four categories of materials, (paper & cardboard, glass containers, aluminum cans and plastic) during the period 1982 to 2010.
Overall, two of the materials (paper and glass) were recycled from the start; aluminum began in 1986 and plastics in 1990. The earlier that recycling of a material began, the higher its rates were. Thr
 Related Questions