
Feedback and Rank on IELTS Writing task 1
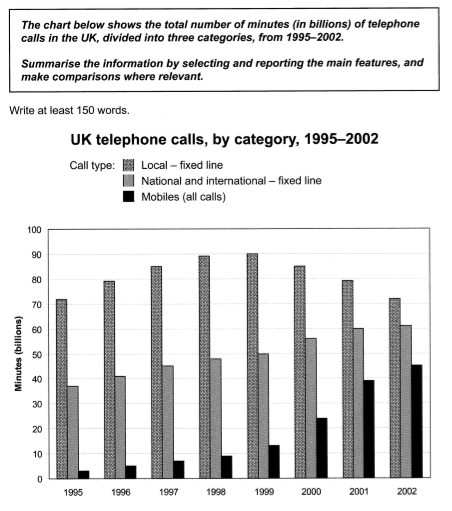
The chart presents some data regarding how Britons spend their time at the telephone in the period 1995-2002. There are three different groups used to categorize the types of calls and at each one is assigned a different colour in the bar chart.
National and international calls, as well as the mobile ones, follow an increasing trend. In particular, mobile calls are growing exponentially in the last years, moving from 2 to 45 billion minutes.
Local calls, instead, do not follow any clear trend. In fact, in the first period, the minutes in national calls increase until they reach the peak which is roughly 90 billion. From that point on, the overall number of minutes started shrinking to 72 billion in 2002, which was the same amount recorded in 1995.
Overall, Britons still preferer local calls, albeit the differences between this type of call and the other ones has been greatly narrowed in the last period due to the growth of mobile, national and international calls and the decrease of the local ones.
thank you in advance!
Top answer
) chart presents some data regarding how Britons spend their time at the telephone (That is not what is on the chart. How they spend their time would be in bed, at home, at work, playing golf, and other activities. Write exactly what is plotted.
- ) chart presents some data regarding how Britons spend their time at the telephone (That is not what is on the chart.
- How they spend their time would be in bed, at home, at work, playing golf, and other activities.
- Write exactly what is plotted.
- ) in the period 1995-2002.
- ) used to categorize the types of call s and at each one is assigned a different colour in the bar chart .
Get the Weekly English Kit 📬
New words, one handy idiom, and a 2-minute quiz — delivered to your inbox to keep your streak alive.
The (what kind of chart?) chart presents some data regarding how Britons spend their time at the telephone (That is not what is on the chart. How they spend their time would be in bed, at home, at work, playing golf, and other activities. Write exactly what is plotted. and the units of measurement.) in the period 1995-2002. There ar
 Related Questions