
Experts, please help with my double data source Task 1!!!!!
Dear, Experts.
I am making attempts on writing as best responses to double data source Task 1 questions I could. So, please make comments and correct this essay if you could.
Thank you so much in advance.
--------
Here's the question:
--------
And here's my response:
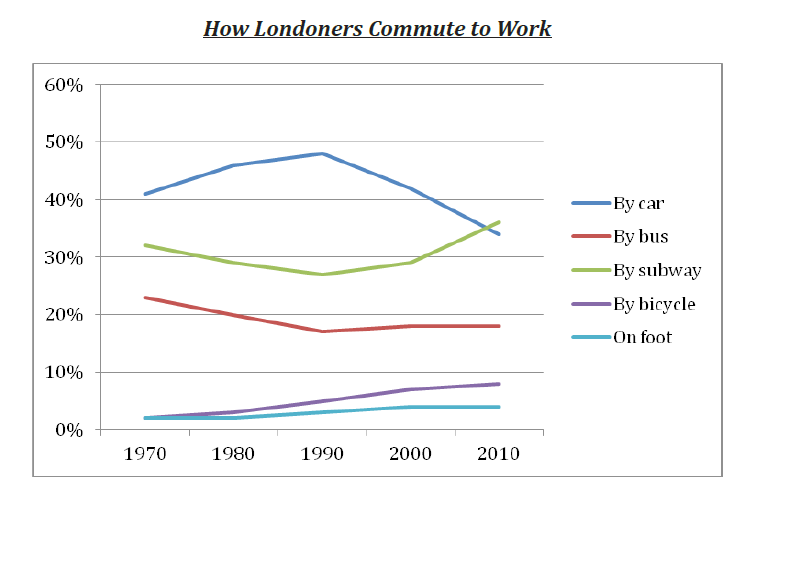
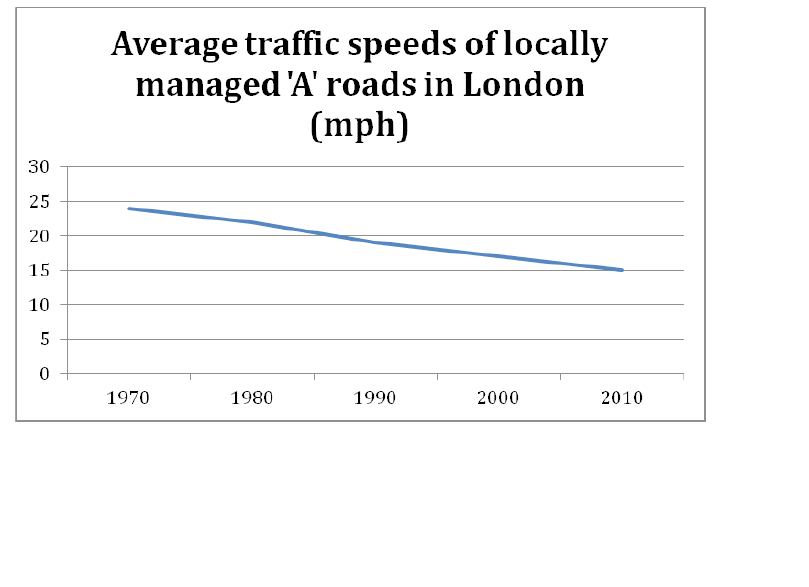
The first line graph compares the percentage of London's inhabitants getting to work by five different means of transport; while, the second shows the speed of their travel over five decades since 1970. Overall, the exchange of the ways they go to work resulted in a gradual decrease in their travel speed.
In detail, the percentage of people in London travelling to work by car started by far the highest at 41% in 1970, increased considerably to 48% after two decades, then fell dramatically to just 34% by the year 2010; meanwhile, travelling by bus saw a slight decrease from 23% in 1970, then reached a plateau at 17% over the second half of the period. The pattern for subway travelling at first moved in tandem with that of bus, falling slightly from 32% in 2010 to 28% in 1990, then rose significantly to 38% in by 2010, which was slightly higher than that of car in the same year. Although cycling and walking made up small portions of the total, their very gradual increase together with the rise, stability and dramatic decline in underground, bus and car use respectively contributed to the exchange in the ways Londoners got to work, which led to a noticeable reduction in the speed of travel from 24 mph in 1970 to only 15 mph by the year 2010.
Top answer
The first line graph compares the percentage of London's inhabitants getting who get to work by one of five different means of transport [ 1] ; while, [ 2] , while the second shows the speed of their travel [ 3] motorists on A roads over the same period. [ 4] five decades since 1970. Overall, the exchange [ 5] of the ways they go to work resulted in a gradual decrease in their travel speed .
- The first line graph compares the percentage of London's inhabitants getting who get to work by one of five different means of transport [ 1] ; while, [ 2] , while the second shows the speed of their travel [ 3] motorists on A roads over the same period.
- [ 4] five decades since 1970.
- Overall, the exchange [ 5] of the ways they go to work resulted in a gradual decrease in their travel speed .
- ----------------------------------------------------------- [ 1]: List them.
- [ 2]: Note the correct punctuation around “while”.
Get the Weekly English Kit 📬
New words, one handy idiom, and a 2-minute quiz — delivered to your inbox to keep your streak alive.
The first line graph compares the percentage of London's inhabitants getting who get to work by one of five different means of transport [ 1] ; while, [ 2] , while the second shows the speed of their travel [ 3]
 Related Questions