
Experts, please help me with my task 1!!!!!!!!!!!!!!!!!!
Dear, Experts.
Please have a look, comment and correct as much as you could.
Thank you so much in advance.
-----------
Here's the question:
-----------
Here's my task 1 response:
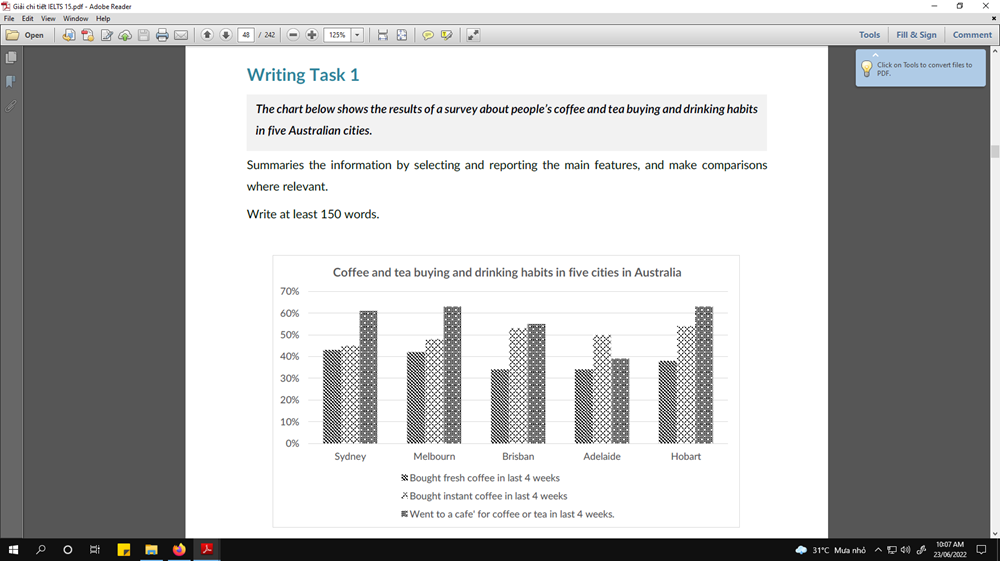
The bar chart compares the consumptions of coffee and tea divided into three categories (drinking in shops, buying instant coffee and buying fresh coffee) in five cities (Sydney, Melbourne, Brisbane, Adelaide, and Hobart) in Australia over four weeks.
Overall, it is common that people in the five cities had coffee or tea in shops in the last four weeks; whereas, they were the least interested in purchasing fresh coffee over the same period.
Citizens of Melbourne, Hobart and Sydney went to shops for coffee or tea the most, at 64%, 63% and 61%, respectively. Although the lowest percentage in this category was just nearly 50% in Adelaide, it was relatively high compared to the other two categories.
For instant coffee, Hobart's people interested the most, at 54%, followed by the Brisbane, slightly lower at 53%. The Sydney bought it the least, at over 45%.
Fresh items were purchased the most in Sydney, at 44%, just slightly higher than the number of Melbourne, 43%. The average percentage of consumers on fresh coffee in the five cities was the lowest of the three categories, at approximately 40% in comparison with purchasing instant coffee, at nearly 50%, and coffee or tea drunk at shops, at just over 55%.
Top answer
The bar chart compares the [ 1 ] consumptio n of coffee and tea divided into three categories (drinking in shops, buying instant coffee and buying fresh coffee) in five cities (Sydney, Melbourne, Brisbane, Adelaide, and Hobart) in Australia over the previous four weeks. Overall, [ 2 ] it is common that the most popular option for people in th os e five citie s, apart from Adelaide, was to go to a cafe, had coffee or tea in shops in the last four weeks; [ 3 ] where as they were the least interested in purchasing fresh coffee over the same period. [ 4 ] Citizens of The proportion of people in Melbourne, Hobart and Sydney who went to cafes was just over 60%.
- The bar chart compares the [ 1 ] consumptio n of coffee and tea divided into three categories (drinking in shops, buying instant coffee and buying fresh coffee) in five cities (Sydney, Melbourne, Brisbane, Adelaide, and Hobart) in Australia over the previous four weeks.
- Overall, [ 2 ] it is common that the most popular option for people in th os e five citie s, apart from Adelaide, was to go to a cafe, had coffee or tea in shops in the last four weeks; [ 3 ] where as they were the least interested in purchasing fresh coffee over the same period.
- [ 4 ] Citizens of The proportion of people in Melbourne, Hobart and Sydney who went to cafes was just over 60%.
- shops for coffee or tea the most, at 64%, 63% and 61%, respectively.
- Although the lowest percentage in this category was [ 5 ] just nearly 50% in Adelaide, it was relatively high compared to the other two categories .
Get the Weekly English Kit 📬
New words, one handy idiom, and a 2-minute quiz — delivered to your inbox to keep your streak alive.
The bar chart compares the [ 1] consumption of coffee and tea divided into three categories (drinking in shops, buying instant coffee and buying fresh coffee) in five cities (Sydney, Melbourne, Brisbane, Adelaide, and Hobart) in Australia over the previous four weeks.
Overall, [
 Related Questions