
Description of the graph. Plz, Someone help me with this. Thanks so much
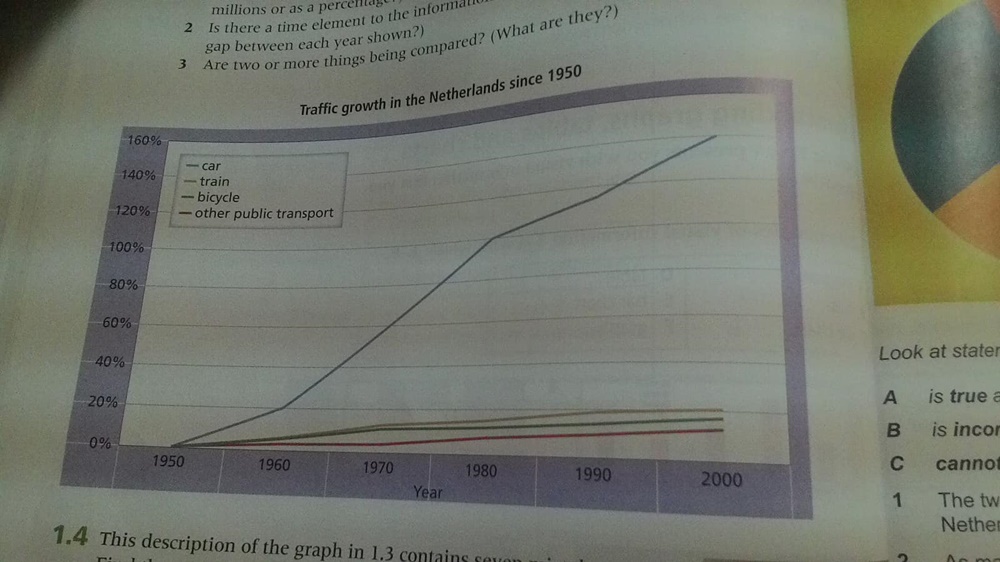
The graph gives information about the increases ih traffic in the Netherland in a 50 - year period from 1950. As we can see from this graph, there was no sign of decreases in all these traffic types: car, train, bicycle and other public transport.
The fastest growth is seen in car traffic with 140 percent during this time. While this figure of train traffic is approximately 20 percent in increases.Bicycle and other public transport also rose by 17 percent and 15 percent in respectively.
Top answer
) traffic in the Netherland in (wrong word. "over") a 50 - year period from 1950. As we can see from this graph, T here was no sign of decreases in all these traffic (wrong word - transportation or transport) types: car, train, bicycle and other public transport.
- ) traffic in the Netherland in (wrong word.
- "over") a 50 - year period from 1950.
- As we can see from this graph, T here was no sign of decreases in all these traffic (wrong word - transportation or transport) types: car, train, bicycle and other public transport.
- The fastest growth is seen in car traffic with which increased 140 percent during this time.
- Bi cycle and other public transport also rose by 17 percent and 15 percent in respectively.
Get the Weekly English Kit 📬
New words, one handy idiom, and a 2-minute quiz — delivered to your inbox to keep your streak alive.
The graph gives information about the increases ih (??) traffic in the Netherland in (wrong word. "over") a 50 - year period from 1950. As we can see from this graph, There was
 Related Questions