
0
Cahaya Kebahagiaan Posted 14 years ago
I would like to explain what happen in Sept-Nov. Is it ok like this?
Vocabulary
Describing chart
I would like to explain what happen in Sept-Nov. Is it ok like this?
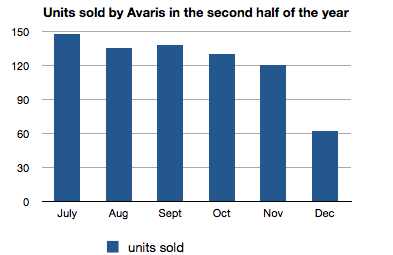
The sales rose to 135 in September only to slip back to 130 again in October, a downward trend that continued in November.
Top answer
According to your graph, July was the month with the highest sales figures. Sales fell in August, but they rose slightly in September. I would mention that fact by saying something like: Compared with August, sales rose slightly to 135 in September then turned downward in October, November and December.
- According to your graph, July was the month with the highest sales figures.
- Sales fell in August, but they rose slightly in September.
- I would mention that fact by saying something like: Compared with August, sales rose slightly to 135 in September then turned downward in October, November and December.
Get the Weekly English Kit 📬
New words, one handy idiom, and a 2-minute quiz — delivered to your inbox to keep your streak alive.
1 Answers
0
According to your graph, July was the month with the highest sales figures.
Sales fell in August, but they rose slightly in September.
I would mention that fact by saying something like:
Compared with August, sales rose slightly to 135 in September then turned downward in October, November and December.
Sales fell in August, but they rose slightly in September.
I would mention that fact by saying something like:
Compared with August, sales rose slightly to 135 in September then turned downward in October, November and December.
 Related Questions