
Dear Teachers, Could you help me to correct my ielts task 1 ? Thanks for your support
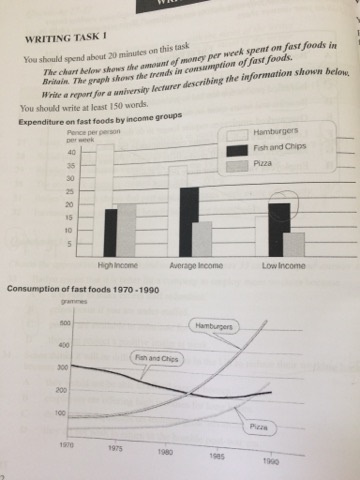
The pie chart illustrates how much money paid out junk foods each week in Britain and the line graph represents the amount of fast foods the British consumed between 1970 and 1990.
The amount of money spent on hamburgers in high income group was the largest. Besides, there was a noticeable growth in the consumption of hamburgers over the course of 20 years starting in 1970.
In high income and average income group, the amount of money in hamburgers was larger than other foods, at over 40% and 33% respectively. The figure of fish and chips stood at 25% in average income group compared to 18% in low income. Whereas, the expenditure on fast foods registered at just under 20% in high income group as opposed to just 8% in low income group.
The consumption of junk foods experienced an upward trend with the exception of the amount of fish and chips between 1970 and 1990. There was a mark rise in the amount of hamburgers between 1970 and 1980 from 90 to 180 grammes per week. On the other hand, the quantity of hamburgers rose significantly from under 200 to 510 grammes over the course of 10 years starting in 1980. Fish and chips was the most popular food at the beginning of the period, consumption reached a peak of 300 grammes in the 1970. After this there was a slight decline. In comparison with the figure of fish and chips, the consumption of pizza increased gradually from 40 to 290 grammes
Top answer
Writings should be posted in our Essay Writing forum, not in our Grammar forum. Thank you.
- Writings should be posted in our Essay Writing forum, not in our Grammar forum.
- Thank you.
Get the Weekly English Kit 📬
New words, one handy idiom, and a 2-minute quiz — delivered to your inbox to keep your streak alive.
Writings should be posted in our Essay Writing forum, not in our Grammar forum. Thank you.
 Related Questions