
Dear teacher, Please help me check my IELTS Writing task 1 report- Line graph. Thank you
Dear teacher,
Please help me check my IELTS Writing task 1 report- Line graph.
Thank you
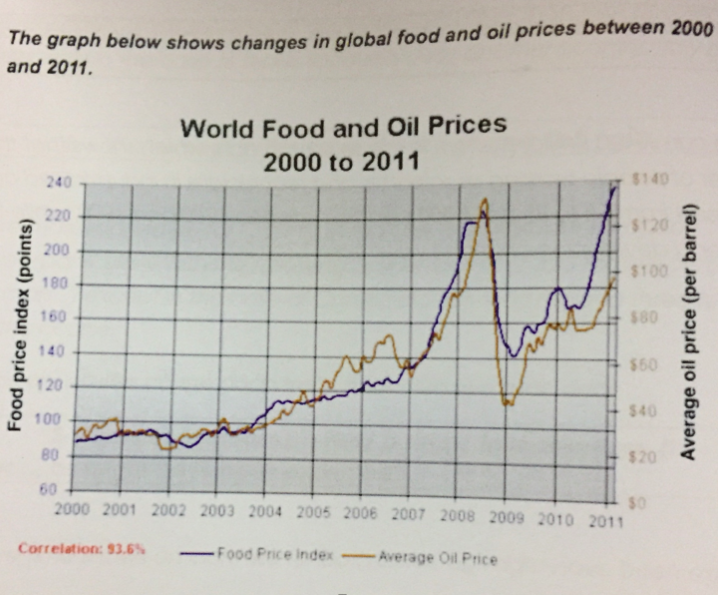
The line graph illustrates the change of food in the world and oil prices from 2000 to 2011.
Overall, it is clear that the food price index and average oil price per barrel increased significantly over the period of 11 years. In addition, the strong correlation with 93.6% is suggested.
In the year 2000, the food price index stood at nearly 90 points, and average oil price per barrel stood at over $20. In the period of 8 years later, the global food and oil prices rose considerably, after both prices stayed relatively stable from 2000 to 2004.
In 2018, the price of world food hit the highest point at nearly 220 points, and the price of average oil price per barrel went up to over $120. However, the year 2009 witnessed a considerable decrease of food price index and average oil price per barrel. The food price index dropped to about 140 points, and the price of oil fell to over $40. Finally, in the year 2011, the food price index increased again, and it reached nearly 240 points, while the average oil price per barrel also climbed to nearly $100.
Top answer
The line graph illustrates the change of food in the world (That is not what the graph shows. Did it change from corn to wheat? ) and oil prices from 2000 to 2011.
- The line graph illustrates the change of food in the world (That is not what the graph shows.
- Did it change from corn to wheat?
- ) and oil prices from 2000 to 2011.
- Overall, it is clear that (Words like "clear", "evident" "obvious" and "apparent" are opinion words.
- Do not write opinions in Task 1.
Get the Weekly English Kit 📬
New words, one handy idiom, and a 2-minute quiz — delivered to your inbox to keep your streak alive.
The line graph illustrates the change of food in the world (That is not what the graph shows. Did it change from corn to wheat? Or from rice to potatoes?) and oil prices from 2000 to 2011.
Overall, it is clear that (Words like "clear", "evident" "obvious" and "apparent" are opinion words. Do not write opinions in
 Related Questions