
Dear teacher Please help me check my IELTS Writing task 1 report- Line graph-3 Thank you
Dear teacher
Please help me check my IELTS Writing task 1 report- Line graph-3
Thank you
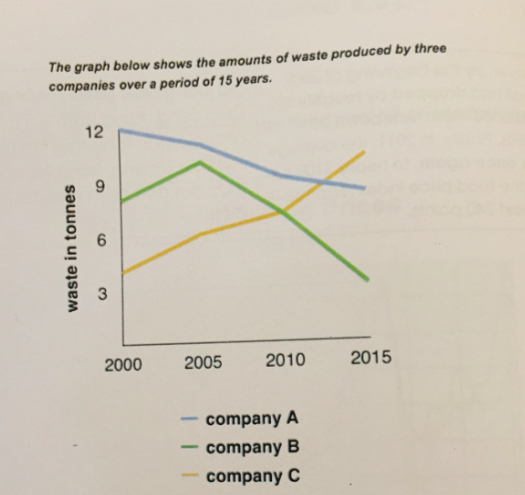
The line graph illustrates the figure for waste output in three different companies A, B and C from 2000 to 2015.
Overall, it is clear that there were a significant change about the amounts of waste output from three companies A, B and C. In the period 15 years, the figure for waste produced by the companies A and B dropped sustantially, while the amount of waste output in company C increased significantly.
In the year 2000, the waste produced by company A at 12 tonnes, while companies B and C produced about 8 tonnes and 4 tonnes. Over the following 5 years, the waste produced by company A decreased slightly aproximately 11 tonnes, while the figure for waste of the companies B and C increased about 10 tonnes and 4 tonnes.
From 2005 to 2015, the company C produced more waste and it continues increasing. By 2015, the amount of waste produced by the company C rose significantly nearly 11 tonnes. The year 2015 witnessed a considerably decrease of the amount of waste output in two companies A and B. The amount of waste output in comapnies A and B fell aproximately 9 tonnes and 3 tonnes in the year 2015.
Top answer
Dear teacher, Please help me check this essay.
- Dear teacher, Please help me check this essay.
Get the Weekly English Kit 📬
New words, one handy idiom, and a 2-minute quiz — delivered to your inbox to keep your streak alive.
 Related Questions